Hello, this is Daily Stock, delivering friendly yet sharp insights into global macro trends and hidden market movements.
[Image: /stdaily/uploads/202608/gen_6a88a8ac912aa3.70525181.png]
Executive Summary
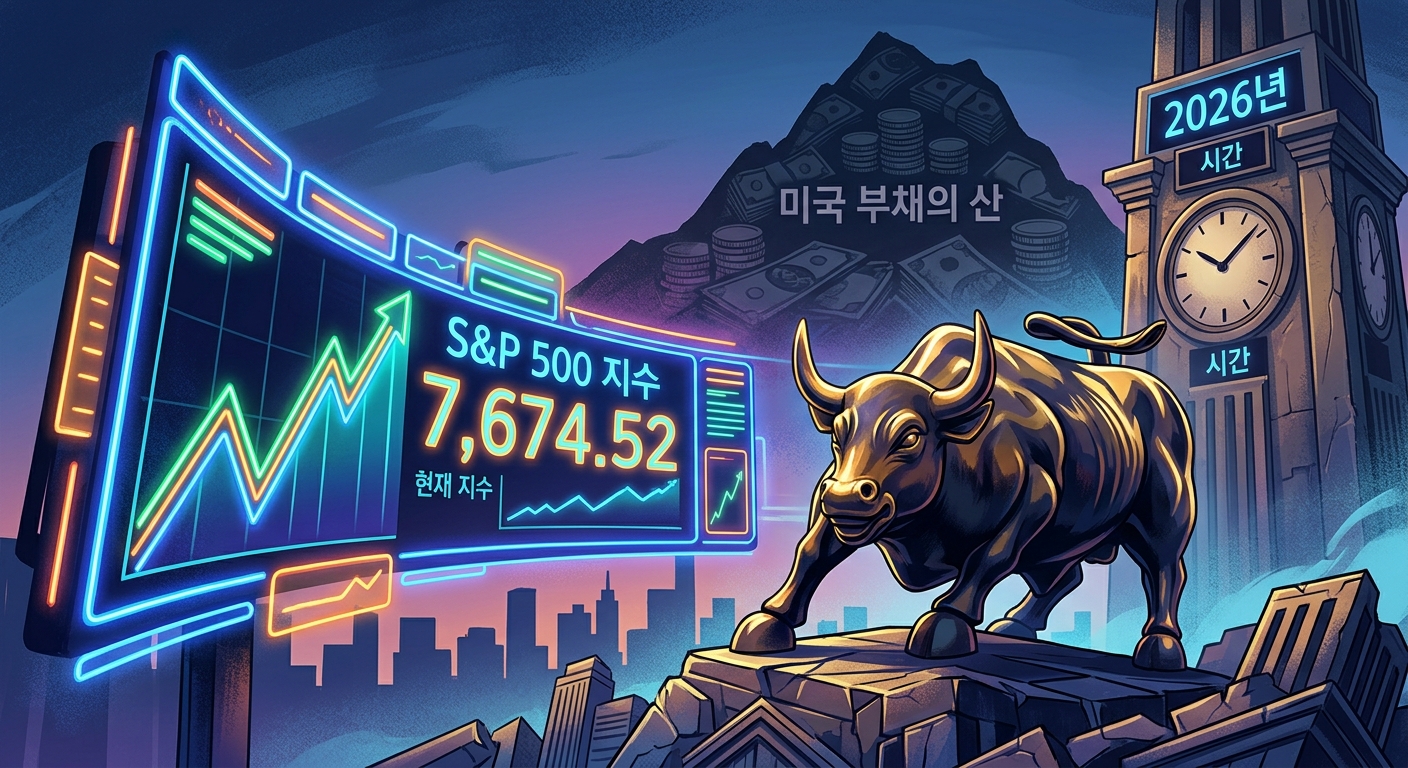
Although the S&P 500 index successfully rebounded to 7,674.52 points overcoming intra-week volatility, the U.S. federal debt has surpassed $40 trillion for the first time in history, with bond market uncertainties continuing to pressure equities.
U.S. Treasury Secretary Scott Bessent's intervention policy—doubling the volume of long-term treasury buybacks (at least $4 billion per session)—is locking horns with hawkish Federal Reserve Chair Kevin Warsh's monetary tightening stance in the background.
Meanwhile, the Shiller Cyclically Adjusted Price-to-Earnings (CAPE) ratio has climbed past the 42x threshold, marking its highest level in 26 years since the dot-com bubble, which once again sparks valuation debates centering on high-flying tech stocks.
Market Overview
Amid intense treasury yield volatility, the U.S. stock market recouped some of its losses, with the S&P 500 closing at 7,674.52 on August 21, 2026 (local time), up 0.44% from the previous day.
This is a step back from the steep rally trajectory in the middle of this month when the index touched an all-time high of 7,816.70 intraday, posting a weekly decline.
Concurrently, under persistent liquidity jitters, the Nasdaq index closed at 26,197.10, and the USD/KRW exchange rate in the Seoul foreign exchange market settled at 1,385.90 won, heightening market caution.
While the Treasury Department stepped in with massive bond repurchases to soothe further bond market tantrums, ballooning fiscal deficits and inflation concerns continue to cap the index's upside.
[Image: /stdaily/uploads/202608/gen_6a88a8b6be6fe6.20316646.png]
Financial Analysis
Although the earnings of S&P 500 companies are showing solid growth supported by robust economic fundamentals, debt servicing burdens for marginal firms are also rising due to prolonged high interest rates.
Reflecting resilient corporate earnings power, global financial institutions have universally raised their 2026 EPS estimate for the S&P 500 from the previous $335 to $350.
The table below highlights the macro comparison and decoupling factors in policy and fundamentals across the U.S., Europe, and Asia.
| Category | United States (S&P 500) | Europe (Euro STOXX 50) | Asia (Nikkei 225) |
|---|---|---|---|
| **Benchmark Index Trend** | 7,674.52 (As of August 21 Close) | Hovering around the mid-4,800s | Fluctuating around the 38,000 level |
| **Key Monetary Policy** | Hawkish stance under Fed Chair Kevin Warsh | ECB exploring moderate, gradual cuts | Bank of Japan's rate hike narrative emerging |
| **Real Economic Indicator** | S&P Global Composite PMI at 56.0 | Weakening resilience in Eurozone Composite PMI | Manufacturing rebound & currency normalization |
| **Commodities & Supply Chain** | High resistance to oil prices via shale revolution | Persistent reliance on energy commodity imports | Import price pressures driven by currency fluctuations |
Valuation
The S&P 500's Shiller CAPE ratio currently oscillates between approximately 41.2x and 42.5x, reaching a historic critical threshold.
This figure exceeds the 32.6x level recorded right before the Great Depression in 1929 and is edging close to the all-time high of 44.19x observed during the peak of the dot-com bubble in 1999.
Elevated valuations indicate that if the earnings growth rate fails to fully support future stock price gains, the market could face heavy multiple contraction pressure.
If megacap IT companies experience a stagnation in gross margin growth or fail to sustain a return on invested capital (ROIC) that exceeds their weighted average cost of capital (WACC), index correction scenarios could materialize.
Analyst & Institutional Commentary
UBS Global Wealth Management recently raised its year-end S&P 500 target substantially to 8,100 points, higher than its previous bullish scenario.
UBS analyzed that the resilience of the U.S. economy, favorable tech infrastructure spending, and efficiency gains from AI adoption justify the valuation upgrades.
On the other hand, fixed-income experts at Nomura and Morgan Stanley point out that given the cumulative U.S. fiscal deficit and treasury issuance size, temporary Treasury interventions may run into limitations.
In particular, they express caution that the Treasury's beefed-up buyback policy could dilute the Fed's tightening resolve, distorting the market and ultimately triggering higher long-term yields.
Risk Factors
The most fundamental risk is the fear of a fiscal doom loop, as the U.S. federal debt breaks above $40 trillion for the first time, pushing annual interest expenses alone above $1 trillion.
If excessive treasury issuance continues, indigestion in the bond market could resurface, pushing the 10-year Treasury yield back up, which would indiscriminately raise the discount rate for equities.
Second, the potential clash between hawkish rhetoric from Fed Chair Kevin Warsh and artificial market support measures (QE-lite) from Treasury Secretary Scott Bessent could undermine the credibility of monetary policy.
Lastly, global supply chain bottlenecks and geopolitical risks in regions like Ukraine and Israel could reignite potential inflationary pressures at any time.
[Image: /stdaily/uploads/202608/gen_6a88a8c14a6fd7.33722715.png]
Investment Outlook
According to Daily Stock's proprietary analysis system, the Nasdaq Fear and Greed Index currently points to Neutral (52.1), indicating that short-term market overheating has cooled down compared to the Greed (64) zone observed a week ago.
The domestic KOSPI Fear and Greed Index is also sitting in the Neutral (55.4) zone, showing that global markets have overall entered a wait-and-see mode ahead of the upcoming Jackson Hole meeting and Q2 earnings releases from major tech companies.
In conclusion, the S&P 500 is projected to continue its volatile path, caught between the solid defense wall of corporate earnings and the heavy burden of excessive debt and high valuation multiples.
Accordingly, rather than chasing rallies, a strategy of increasing defensive portfolio exposure toward dividend growth stocks with robust free cash flow (FCF) and pricing power appears valid.
Key Concepts at a Glance
- **Shiller CAPE 42x**: A long-term valuation metric for the S&P 500, currently far exceeding its historical average of 32.5x and gradually converging toward levels last seen during the dot-com bubble.
- **Treasury Buybacks (QE-lite)**: An intervention card used by the U.S. Treasury to absorb bond market shocks directly by purchasing less-liquid, long-term treasuries to ensure market stability.
- **Kevin Warsh (Fed Chair)**: The new monetary chief leading the Fed after Jerome Powell, who views inflation as a manageable result of internal policy and is actively strengthening preemptive quantitative tightening (QT).
- **Tri-polar Decoupling**: Divergent macro landscapes among a solid, employment-driven U.S. economy, a slowing Europe trying to defend growth, and an Asian market walking a tightrope between beginning monetary tightening and injecting massive liquidity.
- **$40 Trillion Federal Debt**: The U.S. federal national debt, which has reached historic highs due to cumulative deficit spending, serving as a fundamental driver of long-term yield volatility in the bond market.