Hello. This is Daily Stock, delivering precise insights into the flow of the global macroeconomy and the direction of asset markets.
[Image: /stdaily/uploads/202609/gen_6aaedbd2e3a2e8.54866675.png]
Executive Summary
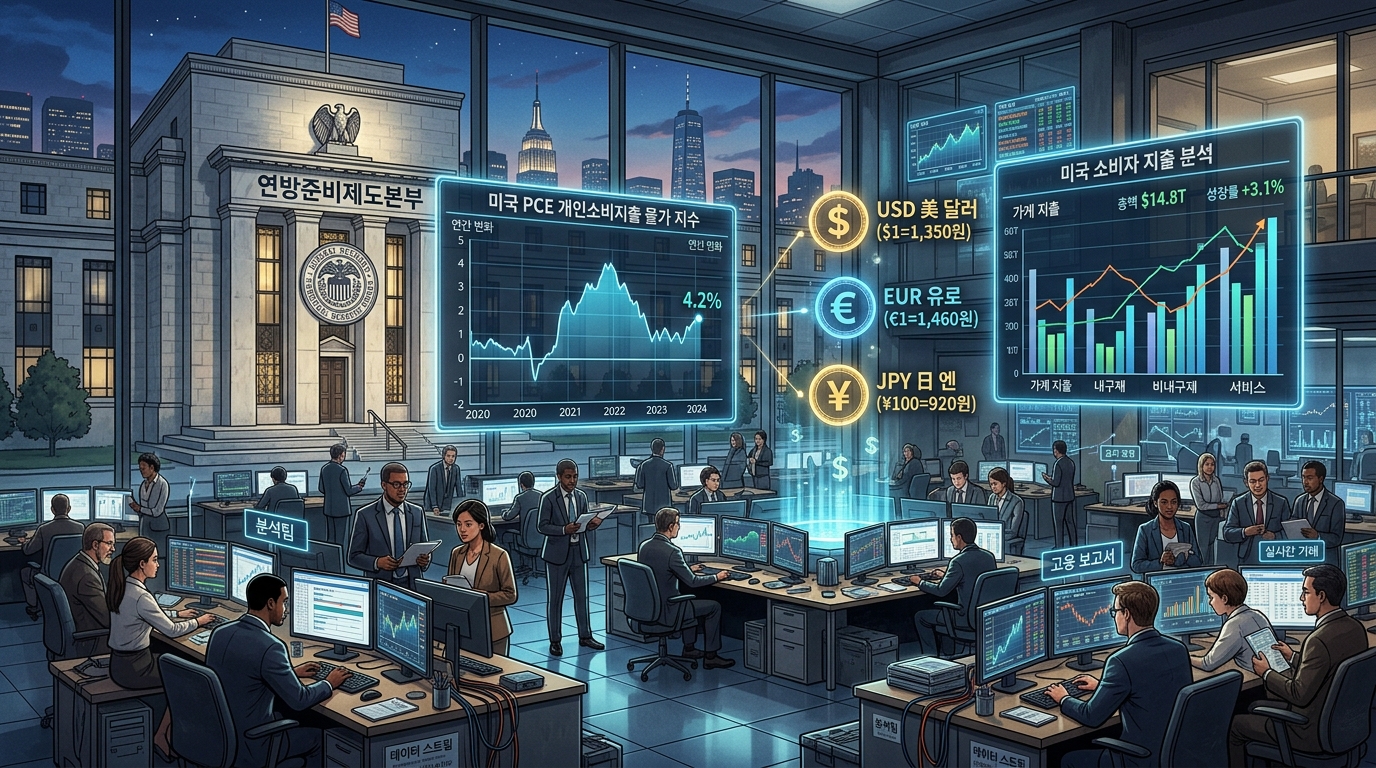
Ahead of the US Department of Commerce's release of the August Personal Consumption Expenditures (PCE) price index, market calculations surrounding the Federal Reserve's (Fed) monetary policy path have grown increasingly intense.
Currently, the Federal Reserve Bank of Cleveland's Inflation Nowcasting and broader market consensus project headline August PCE inflation at around 3.7% year-over-year, with core PCE inflation estimated in the 3.3%–3.4% range.
As the pace of disinflation moderates, global asset markets face a tri-polar decoupling phase driven by divergent fundamentals and monetary policy trajectories across three key economic blocs: the United States, Europe, and Asia.
Market Snapshot
As of the close on September 20, 2026, domestic equity indices ended with the KOSPI at 6,894.23 and the KOSDAQ at 827.12, while the USD/KRW exchange rate closed at 1,389.00 KRW in the Seoul foreign exchange market.
On Wall Street, the tech-heavy Nasdaq benchmark settled at 26,522.55, reflecting a wait-and-see stance and consolidation triggered by interest rate volatility ahead of the inflation data.
Daily Stock's proprietary Fear & Greed Index places the KOSPI at a Neutral reading of 40.9, rebounding from Fear (28.2) one week ago, though cautious sentiment still prevails compared to Neutral (49.6) one month ago and Neutral (53.8) three months ago.
Meanwhile, the Nasdaq Fear & Greed Index stands at Fear (29.1), maintaining subdued sentiment following Fear (32.7) one week ago—a sharp cooling from Neutral (54.6) one month ago and Greed (66.5) three months ago.
Financial Analysis
The PCE data—the central engine of the US economy—reveals a complex dynamic: a gradual deceleration in goods consumption alongside persistent stickiness in services spending.
According to recently released July PCE data, total personal consumption expenditures reached an annualized seasonally adjusted rate of $22.2504 trillion, sustaining modest expansion compared to the prior month.
However, while growth in real disposable personal income among US households has slowed, rising credit card delinquency rates and downward-trending personal saving rates indicate that consumer spending capacity may face tighter constraints ahead.
Within the core PCE index (excluding food and energy), non-housing service prices—such as transportation—continue to show downward rigidity alongside housing costs.
This sticky price pressure in the services sector caps further declines in 10-year US Treasury yields and serves as a major financial driver reigniting the debate over the Fed's neutral interest rate (r*).
| Region & Major Economies | Key Inflation Metric (YoY) | Policy Rate Status & Outlook | Manufacturing PMI Trend | Policy Divergence Characteristics |
|---|---|---|---|---|
| **United States (Fed)** | Aug PCE 3.7% / Core 3.3–3.4% (Forecast) | Tight stance sustained; data-dependent fine-tuning | ~49.0 (Neutral threshold) | Calibrating pace amid robust consumption & cooling labor |
| **Europe (ECB)** | Aug HICP ~2.2% | Gradual rate-cutting stance | 45.8 (Continued contraction) | Responding to growth slowdown; pricing in disinflation |
| **Asia (KR / JP / CN)** | S. Korea 2.0% / Japan 2.8% / China 0.6% | KR (holding under review), JP (weighing hike), CN (easing) | Mixed across region (China 49.1) | Bifurcation: BOJ normalization vs. PBOC liquidity injection |
[Image: /stdaily/uploads/202609/gen_6aaedbdd9683a2.91513596.png]
Valuation
The valuation dispersion across the three global economic blocs directly reflects the divergence in central bank policy maneuvering room heading into the August PCE release.
The 12-month forward price-to-earnings (Forward P/E) multiples for the US S&P 500 and Nasdaq 100 stand at 21.5x and 25.8x, respectively, remaining above long-term historical averages.
In contrast, the pan-European STOXX 600 trades at a 12-month forward P/E of around 13.2x, reflecting a distinct valuation discount relative to US equities due to manufacturing sluggishness and energy cost uncertainties.
In Asian markets, Japan's TOPIX trades at roughly 14.5x, while South Korea's KOSPI remains in an undervalued bracket, trading below 1.0x P/B and around 10.5x forward P/E.
For US equities to sustain premiums anchored by artificial intelligence (AI) infrastructure investments and consumer resilience, the August PCE print must reaffirm that inflation stabilization remains on track.
Expert & Institutional Perspectives
Major Wall Street investment banks view this August PCE report as a critical juncture that could redefine the internal balance between hawks and doves at the Fed.
Goldman Sachs' macro strategy team noted that while oil price volatility could lift headline figures, slowing wage growth should ultimately foster price stability in core services.
Conversely, JPMorgan warned of potential tariff policies and supply chain realignments that could sustain import price pressures, posing the risk that core PCE remains entrenched in the low-3% territory over the medium term.
Unlike the European Central Bank (ECB) and the Bank of England (BOE), which are broadening policy leeway toward monetary easing to support growth, the Fed's cautious posture continues to underpin the relative strength of the US dollar.
At the same time, opposing monetary policy paths across key Asian economies—such as potential additional rate hikes by the Bank of Japan (BOJ) versus reserve requirement ratio (RRR) cuts by the People's Bank of China (PBOC)—are cited as key variables amplifying volatility in global capital flows.
Risk Factors
The primary downside risk stems from potential spikes in international crude oil (WTI) and raw materials driven by escalating Middle East conflicts or disruptions in the Strait of Hormuz.
If higher crude oil costs are passed through into freight rates and manufacturing expenses, transportation and logistics service components within the Fed's preferred PCE gauges could rebound.
Additionally, disruptions in global copper supply chains and rising tariffs from spreading protectionism remain potential triggers that could disrupt the downward trajectory of core goods inflation.
With short-term sentiment subdued—as reflected in the Nasdaq Fear & Greed Index at 29.1 (Fear)—an upside surprise in the inflation reading could prompt sharp valuation compression.
Investment Perspective & Strategy
Ahead of the August PCE release, market conditions warrant focusing on liquidity management and portfolio defensiveness rather than aggressive directional bets.
In the short run, investors should look past temporary headline spikes and closely examine the trajectory of core services excluding housing (supercore inflation).
Over the medium term, attention should be directed toward currency and liquidity arbitrage opportunities arising from the contrast between easing monetary cycles in Europe/Asia and the Fed's data-dependent interest rate path.
Maintaining adequate cash reserves while adopting a staggered accumulation approach toward high-quality dividend-yielding assets and blue-chip tech leaders with proven earnings defense offers a prudent strategy should volatility expand.
Investor Checkpoint Q&A
Q1. Why does the PCE price index carry greater market weight than the CPI for the Fed?
A1. The PCE index uses a chained index formula that accounts for real-time consumer substitution among items, and it serves as the Fed's official benchmark for targeting its 2% inflation mandate.
Q2. What does the current Nasdaq Fear & Greed Index reading of 29.1 indicate?
A2. It shows that market sentiment has fallen into 'Fear' territory due to heightened volatility and fading momentum, suggesting an environment where participants react sensitively to negative catalysts while taking a cautious approach toward positive developments.
Q3. How should currency volatility be managed amidst this tri-polar decoupling?
A3. With the USD/KRW rate lingering near elevated levels around 1,389.00 KRW, maintaining a balanced distribution between currency-hedged and unhedged holdings provides an effective hedge against foreign exchange risks.
Q4. Does the relative discount of European and Asian equities present an immediate buying opportunity?
A4. While valuation metrics appear attractive, it is generally safer to increase allocations incrementally only after tangible fundamental recovery signals appear, such as a turnaround in European manufacturing PMIs and Chinese domestic consumption.
Q5. Which market indicator should be watched most closely immediately after the data release?
A5. Key metrics to monitor right after the print include the yield reaction across US 2-year and 10-year Treasuries, alongside implied shifts in the probability of year-end rate adjustments within Fed Funds futures.