Hello.
This is Daily Stock, delivering fast and accurate insights on global financial market trends.
Summary
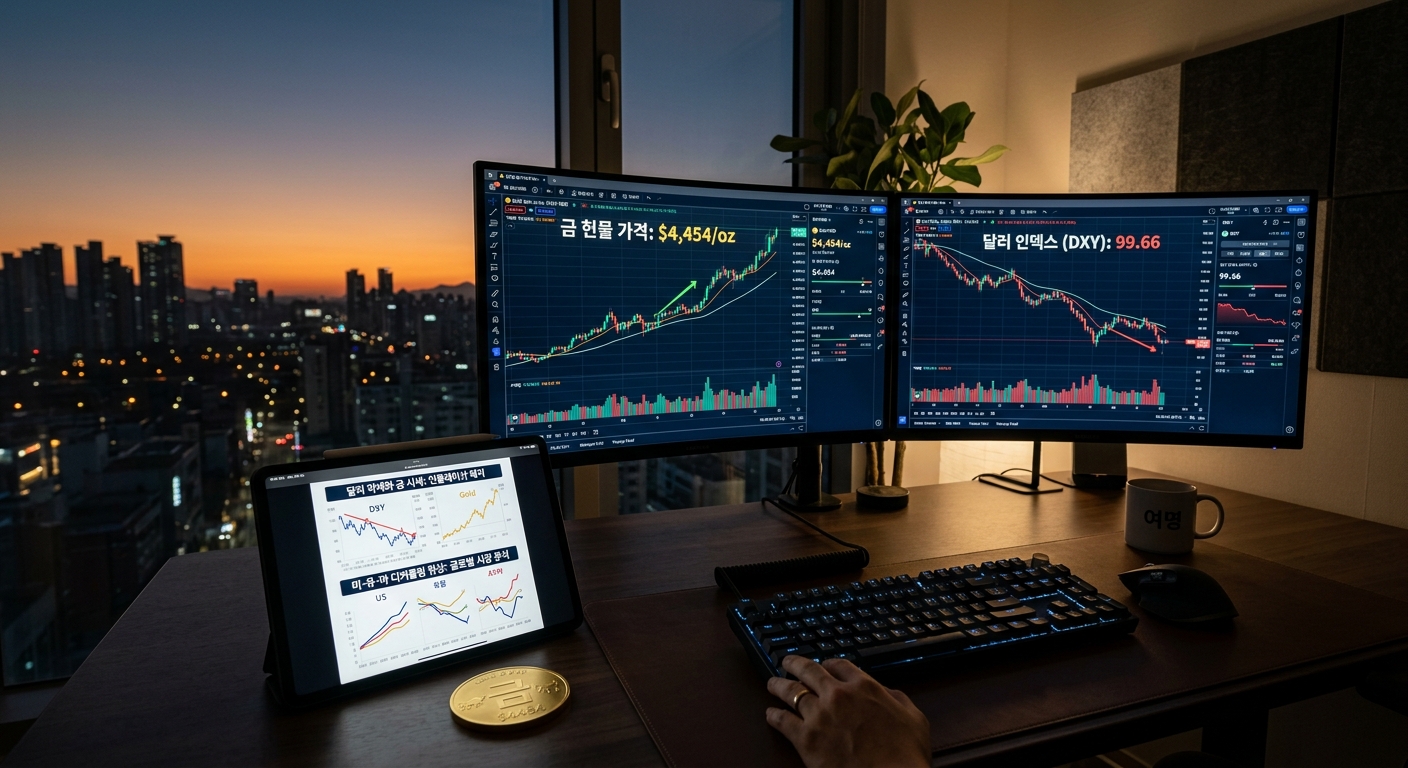
- The US Dollar Index (DXY) has slipped below the 100 level to 99.66, continuing a tight battle around its 3-month low.
- International gold prices are experiencing short-term consolidation around the $4,454 level—down from historical highs near $5,600. However, amid long-term dollar weakness and sustained central bank buying, gold's appeal as a portfolio hedging asset remains prominent.
- Amid the deepening three-way decoupling (US tech leadership vs. European manufacturing slowdown vs. divergent Asian liquidity), global macroeconomic cracks and diverging monetary policies are redefining valuations across safe-haven assets.
Market Overview
As of August 31, 2026, the US Dollar Index (DXY) stood at a tentative intraday level of 99.661 on the preceding trading day (August 28), testing long-term support below the 100 mark.
This comes as US July CPI settled at 3.4% and Core CPI at 2.5%, gradually easing inflation concerns, while the Federal Reserve's pivot (rate cut) signals became clearer following the Jackson Hole meeting.
Conversely, international gold futures and spot prices traded on the New York Mercantile Exchange (COMEX) closed around $4,454.08 per ounce, showing a temporary breather.
While this is down from the all-time high of around $5,600 reached in late January, it still represents a robust year-over-year surge of approximately 29.13%, maintaining a strong long-term upward trend.
[Image: /stdaily/uploads/202608/gen_6a947e2e8cf379.87628049.png]
At the same time, fundamental trends across Asia and Europe are showing distinct differences, accelerating market decoupling.
In the US, massive capital expenditures (CAPEX) in the artificial intelligence (AI) sector and solid tech corporate earnings continue to drive the market. Meanwhile, Europe is struggling with a persistent slowdown in manufacturing PMIs and energy supply issues.
In Asia, the People's Bank of China (PBOC) maintains an active monetary easing stance, complemented by an unprecedented physical gold-buying pace from regional central banks, which is skewing supply-demand dynamics in the commodities market.
| Indicator | Tentative Value / Close (As of 2026-08-31) | Weekly Volatility & Trend |
|---|---|---|
| KOSPI | 6,788.88 (Pre-market tentative) | Attempting to establish recent support level |
| KOSDAQ | 838.41 (Pre-market tentative) | Eyeing expansion of positive sentiment to small/mid-caps |
| NASDAQ | 26,402.42 (Weekend intraday tentative) | High volatility and resistance testing in tech stocks |
| USD/KRW | 1,380.50 KRW (Pre-market tentative) | Testing Won resilience amid downward pressure on USD |
| Dollar Index (DXY) | 99.661 | Watching if weakness persists below the 100 level |
| Gold Price (XAU) | $4,454.08 (per ounce) | Establishing short-term support and consolidating |
Financial Analysis
While physical gold does not generate cash flows or income statements like typical corporations, indirect valuation can be gauged by analyzing the financial health and All-In Sustaining Costs (AISC) of major global gold mining companies.
According to recent reports from leading global miners such as Newmont and Barrick Gold, average AISC per ounce is being stably managed around $1,350 to $1,500.
Consequently, the current market price of $4,454 per ounce significantly maximizes profit margins for mining companies.
The resulting strong cash flows are leading to share buybacks and increased dividends, reinforcing the financial attractiveness of gold mining equities (GDX).
Furthermore, financial hedging demand among global multinationals remains robust.
As the Dollar Index slides to the 99.6 range, US big tech firms with high proportions of overseas revenue are seeing increased foreign exchange (FX) gains. Meanwhile, Asian manufacturers with high raw material import shares have reached a financial inflection point where cost-saving benefits are starting to materialize.
Valuation
The most critical valuation metric for the gold market currently is the direction of real interest rates (nominal rates minus expected inflation).
Despite US 10-year Treasury real yields hovering around 2.0% amid successive Fed rate cuts, the gold price's resilience near the upper bound of its historical range indicates that the asset's intrinsic store of value is being re-evaluated.
The Gold/Silver Ratio currently stands at approximately 66.42.
This remains near the midpoint of the historical 60-to-80 range, suggesting that valuations across the precious metals sector are in a neutral state rather than being overheated or distorted.
[Image: /stdaily/uploads/202608/gen_6a947e385373c0.17812242.png]
Additionally, as the Shiller CAPE ratio for the US stock market enters overvalued territory, the Gold/S&P 500 Ratio highlights gold's valuation merit as an alternative asset.
In an environment where Europe and emerging Asian markets show relative weakness compared to the US, gold acts as an independent valuation anchor that is not bound to a specific currency or single-country economic fundamental.
Expert & Institutional Analysis
Global financial institutions support a long-term upward trajectory for gold prices in connection with the weakening dollar.
Goldman Sachs Research recently projected in a report that gold prices could rise to $4,900 per ounce by the end of 2026, driven by sustained physical gold purchases by major central banks.
Bank of America (BofA) also highly rates gold's mid-to-long-term investment appeal, maintaining a positive outlook with a target price of $4,250 for late 2026.
On the other hand, J.P. Morgan analyzed that gold could average as high as $6,000 per ounce in Q4 2026 if macroeconomic uncertainties peak, though it noted that near-term retail chase-buying has somewhat cooled.
Daily Stock's proprietary Fear & Greed Index, which tracks global market sentiment, points to a neutral environment.
The KOSPI Fear & Greed Index is currently Neutral (46.6), compared to Neutral (49.6) a week ago, Extreme Fear (17.8) a month ago, and Neutral (56.6) three months ago.
The Nasdaq Fear & Greed Index is currently Neutral (54.4), compared to Neutral (54.5) a week ago, Fear (37.9) a month ago, and Greed (64.4) three months ago. This suggests that market participants are looking for calm, diversified investment opportunities rather than getting carried away by excessive optimism.
Risk Factors
The primary risk to monitor is a potential hawkish pivot by the Federal Reserve.
If inflation rebounds and pushes real interest rates significantly higher, the opportunity cost of holding non-yielding gold will rise exponentially.
Secondly, a scenario involving supply chain improvements and a broad decline in commodity prices poses a risk.
If industrial commodity prices, such as crude oil and copper, plunge due to global recession worries, overall inflation-hedging demand could decline, leading to a parallel correction in gold.
Lastly, the purchasing pace of global central banks is key.
Emerging market central banks, including the PBOC, have aggressively accumulated gold as part of their dollar-diversification strategies. If they temporarily halt or slow down purchases due to high prices, it could cause a short-term demand vacuum.
Investment Perspective
The threat of a breakdown below the 99.66 level in the Dollar Index and the consolidation of gold at $4,454 represent a classic macro transition phase in the era of US-Europe-Asia decoupling.
Smart money, tracking the inverse relationship between physical assets and fiat currencies rather than getting swayed by short-term equity volatility, is likely to maintain a dollar-cost-averaging portfolio hedging strategy.
For domestic Korean investors, currency fluctuations (Won appreciation) must be factored in as the USD/KRW rate stands at 1,380.50 KRW ahead of the market open.
Therefore, tracking gold value in KRW terms and taking a diversified approach through spot ETFs or the KRX gold market could serve as a rational strategy.
[Image: /stdaily/uploads/202608/gen_6a947e42e94607.98845219.png]
Investment Checklist
Q1. What is the immediate impact of the Dollar Index falling below 100 (to 99.66) on gold prices?
- A weaker US dollar typically enhances the purchasing power of international investors using other currencies, triggering the traditional inverse correlation that boosts gold demand and prices.
Q2. Why did gold prices consolidate from their record high of $5,600?
- Concerns regarding Fed rate path-driven inflation have partially eased, and short-term profit-taking around the recent Jackson Hole meeting has led to support-building near the $4,454 level.
Q3. Why do central banks continue to purchase physical gold?
- It is part of a portfolio diversification strategy aimed at reducing reliance on the US dollar and maximizing the safety of foreign exchange reserves amid geopolitical risks and supply chain fragmentation.
Q4. Can gold still rise when real interest rates remain relatively high?
- Yes. If global liquidity remains abundant and concerns such as AI valuation doubts or geopolitical uncertainties persist, the safe-haven store of value function can take precedence over yield differences, leading to simultaneous gains.
Q5. How can individual investors position themselves under this scenario?
- Rather than chasing short-term peaks, allocating 5% to 10% of a portfolio to physical gold, gold ETFs, or gold mining equities via systematic, incremental investments remains a highly viable asset allocation strategy.