Hello, this is Daily Stock, your unwavering investment compass in a volatile market.
[Image: /stdaily/uploads/202604/gen_69dd921296a573.20222819.png]
Core Summary
The key to the recent comparison of top S&P 500 sector strengths lies in the pressure from macroeconomic indicators and the mixed earnings of individual companies.
The US Consumer Price Index (CPI) for March 2026 rose by 3.3% year-over-year, raising concerns about sticky inflation.
Due to high inflation, the likelihood of a delayed interest rate cut by the Federal Reserve (Fed) is increasing.
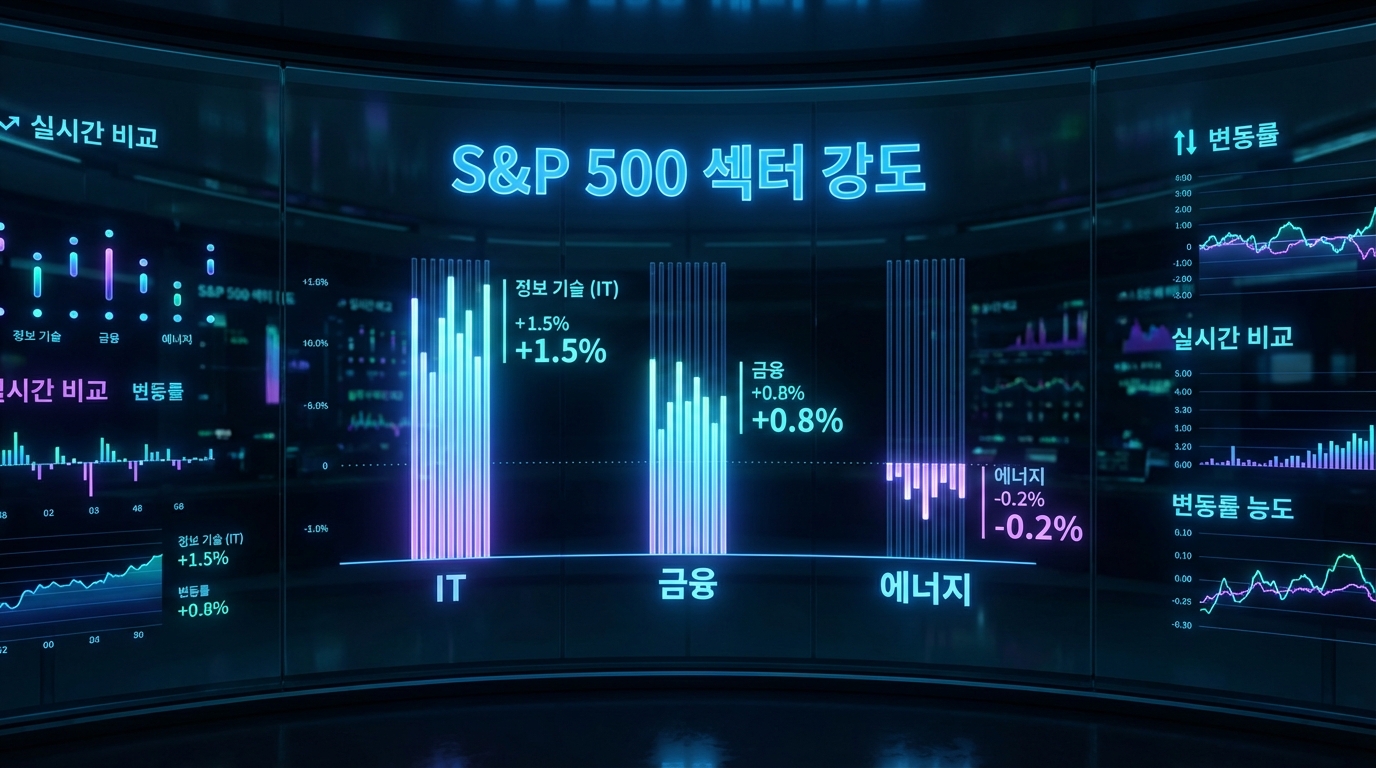
Amidst this, the IT sector is undergoing a valuation reset, but earnings per share (EPS) estimates remain solid, while the strong performance of the financial and energy sectors stands out.
Current Situation Summary
As of intraday trading on April 14, 2026 (provisional), the Nasdaq is at 23183.74, the KOSPI is at 5991.24, and the USD/KRW exchange rate is trading at 1479.00 won.
Although rising raw material prices and interest rate concerns are weighing on the market, the stock market appears to be holding up based on the underlying strength of fundamentals.
According to our proprietary index, the Nasdaq Fear & Greed Index is currently Neutral (41.1), showing a gradual recovery from Extreme Fear (8.4) three months ago.
The KOSPI Fear & Greed Index also currently records Neutral (53.3), escaping the Fear (32) territory from a month ago, indicating a trend of stabilizing investor sentiment.
Financial Analysis
With the Q1 2026 earnings season for S&P 500 companies in full swing, the financial sector is expected to see outstanding EPS growth of about 15.1% year-over-year.
This is the result of the revitalization of capital markets and profitability improvements in the insurance sector acting as strong growth drivers.
The energy sector has seen a steep upward revision in earnings estimates over a short period, boosted by a surge in oil prices stemming from Middle East risks.
Despite the forward price-to-earnings (P/E) ratio for the IT sector, home to large-cap tech stocks, dropping significantly compared to the beginning of the year, its 12-month forward EPS has actually increased by more than 17%, proving its solid fundamentals.
Valuation
Currently, the 12-month forward P/E ratio for the S&P 500 index is at the 20.4x level, slightly above the 5-year average of 19.9x.
However, compared to the peak of 22.0x at the end of last year, the valuation burden has noticeably eased.
[Image: /stdaily/uploads/202604/gen_69dd9227511916.71694934.png]
| Sector Classification | 12-Month Forward P/E | Q1 2026 Expected EPS Growth Rate (YoY) | Sector Momentum & Characteristics |
|---|---|---|---|
| **S&P 500 Average** | 20.4x | +12.6% | Maintaining overall earnings improvement trend and digesting valuation |
| **IT (Information Technology)** | 21.3x | +17.0% | Valuation contraction from early year brings it closer to historical average |
| **Financials** | Around 15.0x | +15.1% | Quality defense driven by investment banking and capital market earnings |
In particular, there are suggestions that supply and demand could diversify into the S&P 400 (MidCap) and S&P 600 (SmallCap), which offer discounted multiples compared to large-cap stocks.
As the valuation gap between value and growth stocks gradually narrows, the market is taking on a stronger stock-picking character.
Expert & Institutional Analysis
According to the financial information provider FactSet, the overall EPS growth rate for S&P 500 companies in 2026 is projected to reach 17.6%.
This suggests that the market is offsetting the negative news of a delayed interest rate cut with the strong cash-generating power of companies.
Global investment bank UBS analyzed that the recent rise in energy prices is increasing short-term inflationary pressure, but this will eventually lead to a consumption slowdown, potentially triggering a Fed rate cut by the end of the year.
Major asset managers like State Street evaluate that multiple contraction has rather created an opportunity to buy blue-chip stocks at reasonable prices.
Risk Factors
The biggest risk is the possibility that a prolonged period of high interest rates could damage the soft landing scenario for the US economy.
According to the Atlanta Fed's GDPNow model, the Q1 2026 economic growth estimate has plummeted from the 3% range early in the year to the recent 1.3% range.
If the Fed maintains a benchmark interest rate of 3.50~3.75% longer than expected, household interest burdens and consumption contraction could accelerate.
Additionally, the high volatility of international oil prices, which stimulates inflation, acts as a detonator that could once again destabilize inflation expectations.
Investment Perspective Summary
In the short term, it is worth considering a strategy of securing some weight in energy and high-dividend financial stocks, which offer excellent defense against rising inflation, to increase portfolio stability.
On the other hand, from a long-term perspective, a dollar-cost averaging approach to quality growth stocks, such as IT and healthcare, where valuation bubbles have somewhat cleared, could be effective.
As this is a market where macroeconomic indicators and individual corporate earnings are clashing head-on, it is advantageous to focus on sectors with unshaken EPS estimates.
We recommend flexibly responding to sector rotations driven by earnings announcements while adjusting portfolio duration.
Investor Checkpoint Q&A
1. What is the key characteristic of the current S&P 500 sector rotation?
The characteristic trend is a broadening of earnings improvements into financials and small/mid-cap stocks, moving away from the past concentration on the top 7 large-cap tech stocks.
2. What was the impact of the March 2026 CPI shock on the stock market?
Headline CPI surged to 3.3%, causing a significant retreat in interest rate cut expectations; paradoxically, however, the solid earnings durability of companies is supporting the bottom of the stock market.
3. Why did the US Q1 GDP estimate drop significantly?
The aftermath of a government shutdown, combined with consumption contraction due to high inflation and a decrease in private investment, acted complexly to lower the GDPNow Q1 estimate to the 1.3% range.
4. Is the valuation correction in the IT sector positive?
As the forward P/E contracted by nearly 20%, it approached historical long-term averages. This is evaluated as a healthy correction that relieves the market's overheating burden and converges to fundamentals.
5. What state does the current Daily Stock Fear & Greed Index indicate?
Both KOSPI (53.3) and Nasdaq (41.1) remain in the 'Neutral' zone, showing that market participants have moved away from past states of extreme fear or greed and are engaging in a rational search for earnings.