[Image: /stdaily/uploads/202604/gen_69cc6e921abef6.72317246.png]
Hello, I am a professional writer for DailyStock.
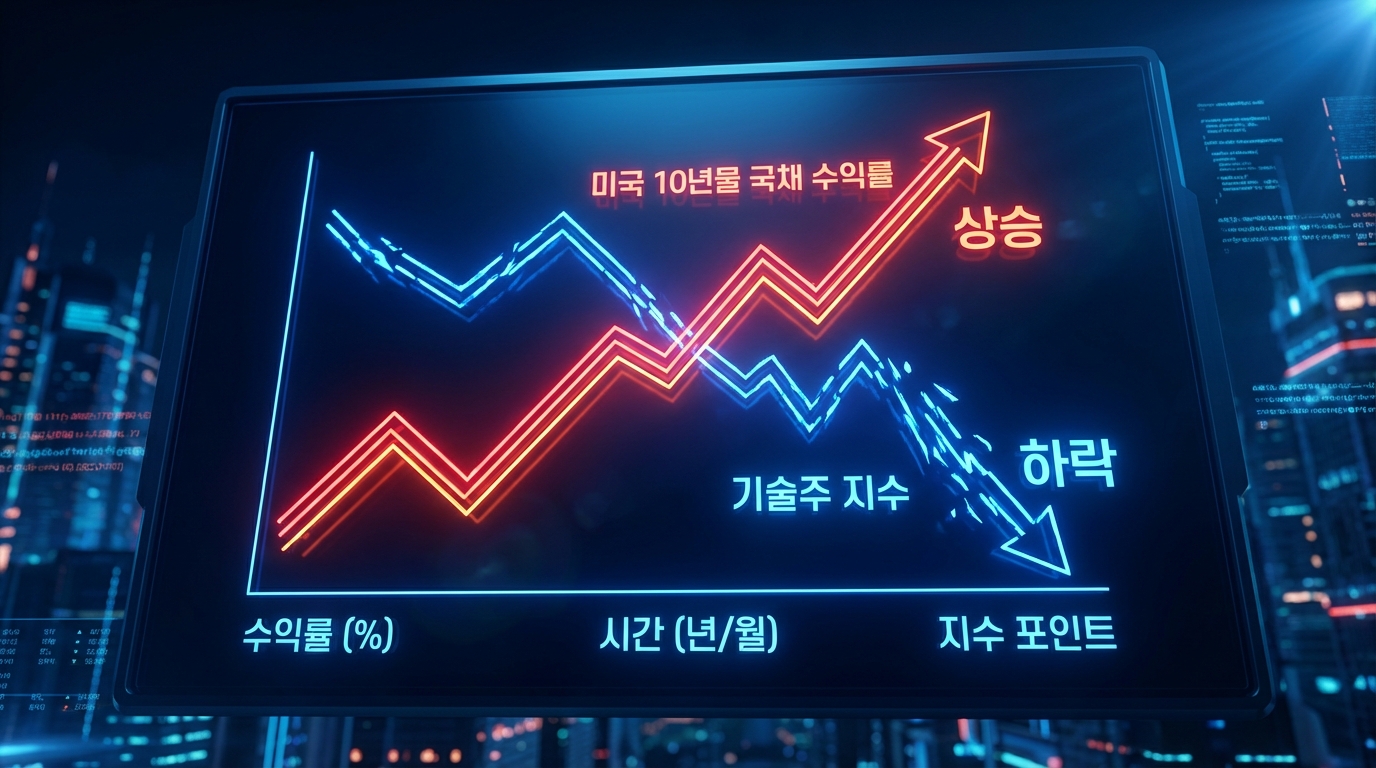
Today, we will closely examine the new dynamics between the US 10-year Treasury yield, which has recently emerged as a key variable in the financial market, and tech stocks.
Core Summary
Recently, the US 10-year Treasury yield is threatening the 4.4% mark, acting as a major volatility factor in the global stock market.
Rising interest rates increase the discount rate on future earnings, raising the possibility of putting direct pressure on large tech stocks, including those on the NASDAQ.
In particular, as expectations for the Federal Reserve's rate cuts have somewhat receded in the first quarter of 2026, overall market investor sentiment is cooling rapidly.
As the tug-of-war between macroeconomic indicators and corporate earnings intensifies, this is a critical juncture where a defensive readjustment of portfolios may be necessary.
Current Situation Summary
As of intraday trading on April 1, 2026 (provisional), the NASDAQ index recorded 21,590.63, reflecting extreme tension among market participants.
At the same time, the KOSPI indicates 5,329.53, the KOSDAQ 1,104.17, and the KRW/USD exchange rate is showing high volatility at the 1,506.40 level.
According to DailyStock's proprietary indicators, the NASDAQ currently remains in the "Extreme Fear" (14.7) zone.
This is a further deterioration from Extreme Fear (18.2) one week ago, suggesting that investor sentiment has frozen coldly from Neutral (41.2) one month ago and Fear (21.1) three months ago.
The KOSPI is also currently in a state of Fear (21.6), widening its decline from Fear (33.5) a week ago and significantly retreating from the Greed (61.7) zone three months ago.
A rapid sector rotation is currently occurring across all 11 sectors within the S&P 500, with a visible possibility of capital shifting from tech stocks to defensive stocks.
Financial Analysis
Large tech stocks boast abundant free cash flow, but in an environment where interest rates are approaching 4.5%, it can be difficult to justify high valuation premiums.
In particular, stocks whose Forward P/E (Price-to-Earnings) ratios significantly exceed historical averages run the risk of maximized volatility depending on changes in future Earnings Per Share (EPS) estimates.
| Category | Large Tech | Defensive | Russell 2000 (Small/Mid-Cap) |
|---|---|---|---|
| **Interest Rate Sensitivity** | Very High (Burden of rising discount rate) | Relatively Low | Very High (Increased borrowing costs) |
| **Forward P/E** | Mid-to-high 20s | High 10s | Mixed (High proportion of deficits) |
| **Dividend Yield** | Under 1% | 2~4% range | Around 1.5% |
| **Core Momentum** | AI & innovative growth | Stable cash flow | Whether macroeconomy soft-lands |
A prolonged high-interest-rate environment leaves room to erode the EPS of not only small and mid-cap stocks with high debt ratios but also growth stocks in general that require massive capital investments.
Therefore, how strongly these companies can prove their profit defense capabilities during the upcoming earnings season is expected to be a key issue for investors.
Valuation
[Image: /stdaily/uploads/202604/gen_69cc6ea8720276.38217180.png]
The valuation gap between value and growth stocks has recently faced a new test along with the rebound of the 10-year Treasury yield.
Because growth stocks share characteristics similar to long-term bonds, their multiples tend to contract rapidly whenever interest rates rise.
Conversely, value stocks paying stable dividends or traditional defensive stocks provide downside rigidity and can serve as safe havens for investors.
The deepening divergence between the large-cap-heavy S&P 500 and the small-cap-heavy Russell 2000 also fully reflects the supply-and-demand skewing phenomenon caused by macro uncertainty.
Expert & Institutional Analysis
The Atlanta Fed's GDPNow model estimates the U.S. economic growth rate for Q1 2026 at around 2.0%, sending a signal of a gradual economic slowdown.
This implies that the explosive growth momentum of the past is calming down, further complicating the Federal Reserve's monetary policy calculations.
Wall Street experts point out that key inflation indicators such as employment figures, Personal Consumption Expenditures (PCE), and the Consumer Price Index (CPI) remain stickier than expected.
Some institutions warn that if the 10-year Treasury yield breaks above the key technical and psychological resistance line of 4.5%, a strong risk-off phenomenon could strike the broader stock market.
Risk Factors
[Image: /stdaily/uploads/202604/gen_69cc6ebf3a1276.85179178.png]
The biggest potential risk currently facing the market is a situation where the perfect 'soft landing' scenario that everyone expected is undermined.
If international oil prices fluctuate and inflation reignites due to deepening geopolitical risks, market interest rates will have no choice but to continue soaring.
Such macroeconomic shocks are highly likely to lead directly to a margin squeeze phenomenon that pressures corporate operating margins.
Furthermore, if marginal companies unable to withstand high interest rates start to collapse, a market-wide downgrade of earnings forecasts and valuation collapse could occur concurrently.
Investment Perspective Summary
In periods like now where macro volatility is maximized, a defensive approach based on indicators can be more advantageous than hasty optimism.
As the NASDAQ Fear & Greed Index currently points to Extreme Fear, it is advisable to avoid aggressive chase buying even if a temporary rebound occurs.
It is necessary to maintain a certain level of cash weighting and condense the portfolio around sectors with low interest rate sensitivity and solid free cash flow generation capabilities.
Scenario responses that prioritize volatility management are recommended until inflation trends and the Fed's stance become clearer.
Investment Checklist
- Are you tracking in real-time whether the US 10-year Treasury yield breaks the key resistance line of 4.5%?
- Is the weighting of tech stocks in your portfolio overly exposed to the risk of multiple contraction from rising interest rates?
- Are you carefully checking the Atlanta Fed's GDPNow trend and the release calendar for employment and inflation (PCE, CPI) indicators?
- Have you effectively lowered the overall macro sensitivity of your account by incorporating value stocks, defensive stocks, or dividend stocks?
- Are you blocking emotional, impulsive trading by referencing objective psychological indicators like DailyStock's Fear & Greed Index?