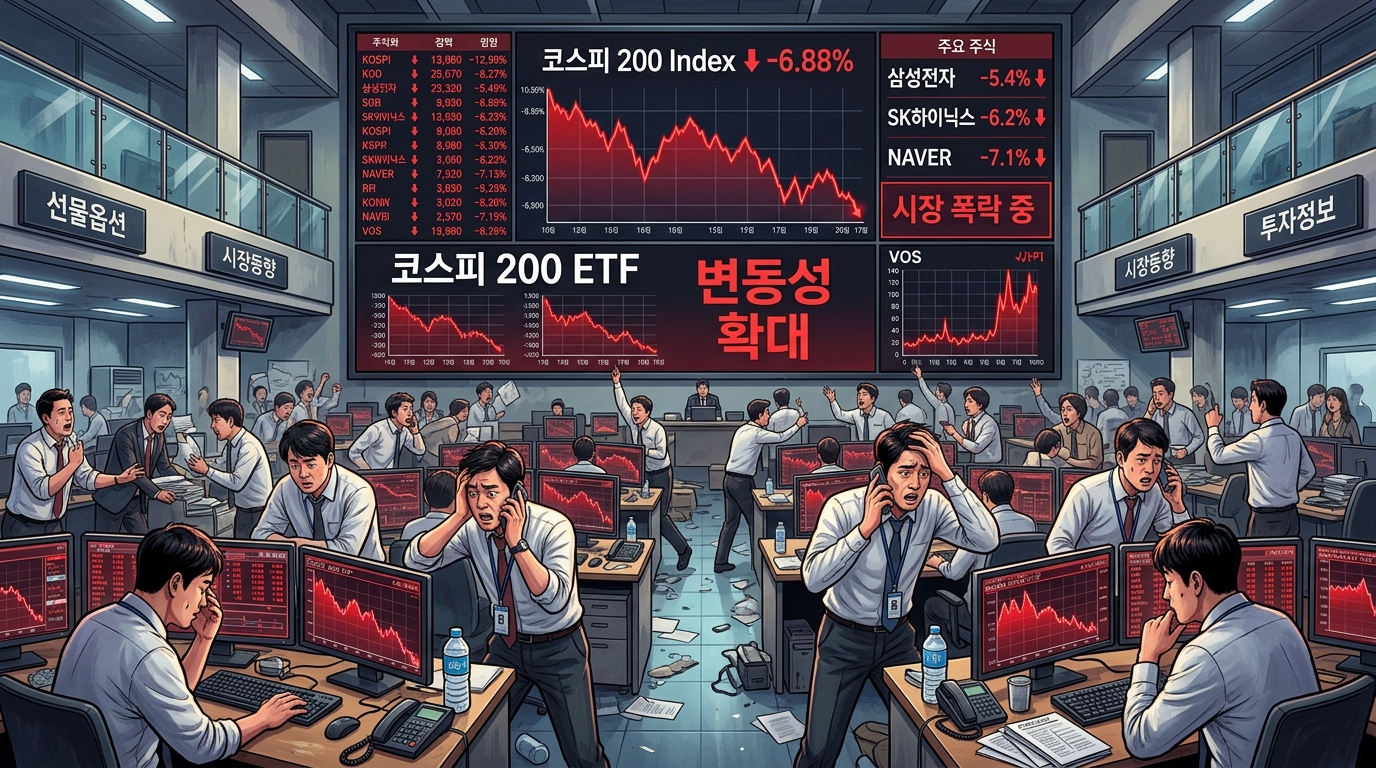
As the domestic stock market enters an unprecedented period of volatility, market attention is focused on capital flows into the benchmark KOSPI index and related exchange-traded funds (ETFs).
Summary
- In July, the total net assets of domestic equity ETFs decreased by 7.8% compared to the previous month, turning downward for the first time since March.
- In the 'Black Monday' crash on July 13, forced liquidations (deleveraging) of single-stock 2x leveraged ETFs flooded the market, amplifying the downward spiral.
- Global investment bank Goldman Sachs presented the 6,800 level as the primary technical support line for the KOSPI, recommending a selective buying approach to utilize the volatility.
Market Overview
As of July 14, 2026, the domestic financial market closed with the KOSPI index at 6,856.83 after a fierce battle at the bottom.
On the previous trading day, July 13, extreme panic selling was seen across the market, with the KOSPI plunging 8.95% (669.01 points) in a single day to collapse to 6,806.93.
As a result, the total net asset value of domestic equity ETFs at the beginning of July was recorded at 304.8371 trillion KRW, a decrease of approximately 7.8% from the end of June (330.6456 trillion KRW).
This marks the first reversal in the growth trend of domestic equity ETF assets, which had been rising consistently since March of this year.
In addition to the drop in valuation caused by the crash of underlying assets, accumulating investor fatigue has led to capital dispersing into alternative financial products.
On the other hand, the net assets of domestic covered call ETFs swelled to 26.7655 trillion KRW as of July 9, proving an inflow of funds into defensive instruments.
[Image: /stdaily/uploads/202607/gen_6a55dee9a7ad56.69580097.png]
Financial Analysis
Changes in demand and supply for the KOSPI 200 index and major related ETFs clearly illustrate recent structural shifts in the market.
In particular, a significant portion of the net selling volume by domestic institutions during the market crash is estimated to be closely linked to the mechanical liquidation of passive funds.
The table below summarizes the trends of domestic ETF assets and key indicators amid the recent volatile market conditions.
| Classification | End of June 2026 (Near Peak) | Mid-July 2026 (As of July 14) | Capital Flow & Supply/Demand Characteristics |
|---|---|---|---|
| **Domestic Equity ETF Net Assets** | 330.6456 trillion KRW | 304.8371 trillion KRW | -7.8% MoM decrease (due to asset valuation drops and capital outflows) |
| **Domestic Covered Call ETF Net Assets** | 25.5062 trillion KRW (As of early June) | 26.7655 trillion KRW (As of July 9) | Net inflow of about 1.2 trillion KRW over the past month (shift to defensive funds) |
| **KOSPI Index Close** | 9,114.50 (Intraday high on June 22) | 6,856.83 (Close on July 14) | Sharp drop due to semiconductor outlook concerns and global AI investment skepticism |
| **Institutional/Foreign Flow Characteristics** | Passive fund inflows during record-high rally | Liquidations centered on program selling | ETF-related liquidations accounted for 62% of institutional net selling on July 13 |
This decline in assets is a combined result of actual net outflows by investors and a drop in the valuation of ETF holdings following the crash of the KOSPI index.
Valuation
The current valuation of the KOSPI is in a complex state where extreme oversold territory and structural supply/demand limits are intertwined.
According to the Daily Stock Fear & Greed Index, the KOSPI Fear & Greed Index currently stands at 12.6 (Extreme Fear), deteriorating further from a week ago (15.1, Extreme Fear).
In contrast, the Nasdaq Fear & Greed Index at the same point in time is recorded at 43.7 (Neutral), indicating that the domestic market is experiencing much stronger psychological contraction compared to overseas markets.
Some global investment banks diagnose the current KOSPI index levels as deeply undervalued from a valuation perspective.
However, critics point out that due to the popularity of single-stock 2x leveraged ETFs unique to the Korean market, mechanical selling triggering more selling is temporarily distorting the market bottom, regardless of the intrinsic value of the underlying assets.
[Image: /stdaily/uploads/202607/gen_6a55def35b5a98.42335144.png]
Expert and Institutional Analysis
In a report titled 'KOSPI Tests Key Technical Support' published on July 14, global investment bank Goldman Sachs analyzed that the recent index crash was amplified by the deleveraging (forced liquidation) of single-stock leveraged ETFs.
As leveraged products based on major semiconductor stocks such as Samsung Electronics and SK Hynix plunged, asset managers were forced to mechanically sell underlying equities to maintain their target leverage ratios.
Goldman Sachs estimated that about 62% of the net selling by domestic institutions on July 13 was tied to these ETF position liquidations.
The firm presented 6,800 as the first key technical support line for the KOSPI. If this level is broken, the next support level is projected at 6,500, with a final support range around 6,100 to 6,000.
However, it added that a strategy of selectively purchasing highly certain stocks among memory semiconductor and blue-chip technology firms whose valuations have dropped could be effective in utilizing this volatility.
Shinhan Securities also evaluated that the primary cause of the decline was a combination of supply/demand tangles and doubts about the sustainability of global AI capital expenditures (Capex), rather than a direct slowdown in corporate earnings.
Risk Factors
The biggest risk factor is the entrenchment of the 'Wag the Dog' phenomenon, where the tail wags the body.
As the scale of net assets in leveraged and inverse ETFs has grown excessively relative to the actual trading volume of the underlying shares, the market's vulnerability has been exposed: minor market tremors feed through mechanical program trading to spark massive crashes.
Secondly, there is the risk of indiscriminate foreign passive capital outflows linked to a surging foreign exchange rate.
The KRW/USD exchange rate is still hovering around the 1,500 KRW mark at 1,494.90 KRW, meaning mechanical program selling pressure due to currency loss concerns among foreign investors could be triggered at any time.
[Image: /stdaily/uploads/202607/gen_6a55defc5e3ce3.87113488.png]
Investment Outlook
For the time being, investing in the KOSPI 200 and major market ETFs should focus strictly on volatility management and conservative portfolio rebalancing.
Confirming whether the index stabilizes around the technical support line of 6,800 must come first, as aggressive entry into leveraged positions carries the risk of exposure to further liquidation spirals.
Instead, high-dividend financial ETFs or active covered call products, which have shown relatively solid defense during market downturns, are emerging as alternative strategies to reinforce the portfolio bottom.
Most importantly, weight should be given to technical positioning through installment buying until stabilization of foreign capital flows and the KRW/USD exchange rate is confirmed.
Investor Checklist Q&A
Q1. What is the direct cause of the recent sharp drop in KOSPI 200 and domestic equity ETF net assets?
A1. The biggest reason is that the valuation of underlying assets plummeted as the KOSPI index corrected sharply from its peak of over 9,100 to the 6,800 level. It is also affected by retail investors turning their attention to global assets due to market fatigue.
Q2. How did the deleveraging (forced selling) of single-stock leveraged ETFs specifically impact the market crash?
A2. When the prices of 2x leveraged ETFs tracking Samsung Electronics or SK Hynix crashed, fund managers had to mechanically sell those stocks in the market to maintain the required leverage ratio. This selling pressure further dragged down stock prices, creating a vicious cycle.
Q3. Was institutional and foreign selling during the July 13 crash also heavily driven by mechanical trading?
A3. Yes. According to Goldman Sachs' analysis, about 62% of domestic institutional net selling on that day consisted of ETF-related liquidations. Net selling by foreign investors was also dominated by program-driven passive capital outflows rather than fundamental corporate value degradation.
Q4. Did covered calls or high-dividend ETFs, which are considered defensive strategies when the index collapses, do their job?
A4. Performance varied greatly depending on product composition. Financial high-dividend ETFs and covered calls composed mainly of banking stocks without Samsung Electronics or SK Hynix showed strong resilience against the index plunge. However, covered call products directly tracking the KOSPI 200 had limitations in fully buffering a historic crash of about 9% in a single day.
Q5. Where are the future KOSPI support lines suggested by Goldman Sachs, and how should investors respond?
A5. The first technical support line is 6,800. If this is broken, 6,500, and subsequently 6,100 to 6,000 could act as strong support lines. Experts advise utilizing the sharp volatility to selectively approach undervalued, high-quality tech stocks.