Hello, this is Daily Stock.
[이미지: /stdaily/uploads/202609/gen_6ab9ae28c399f1.72474597.png]
Executive Summary
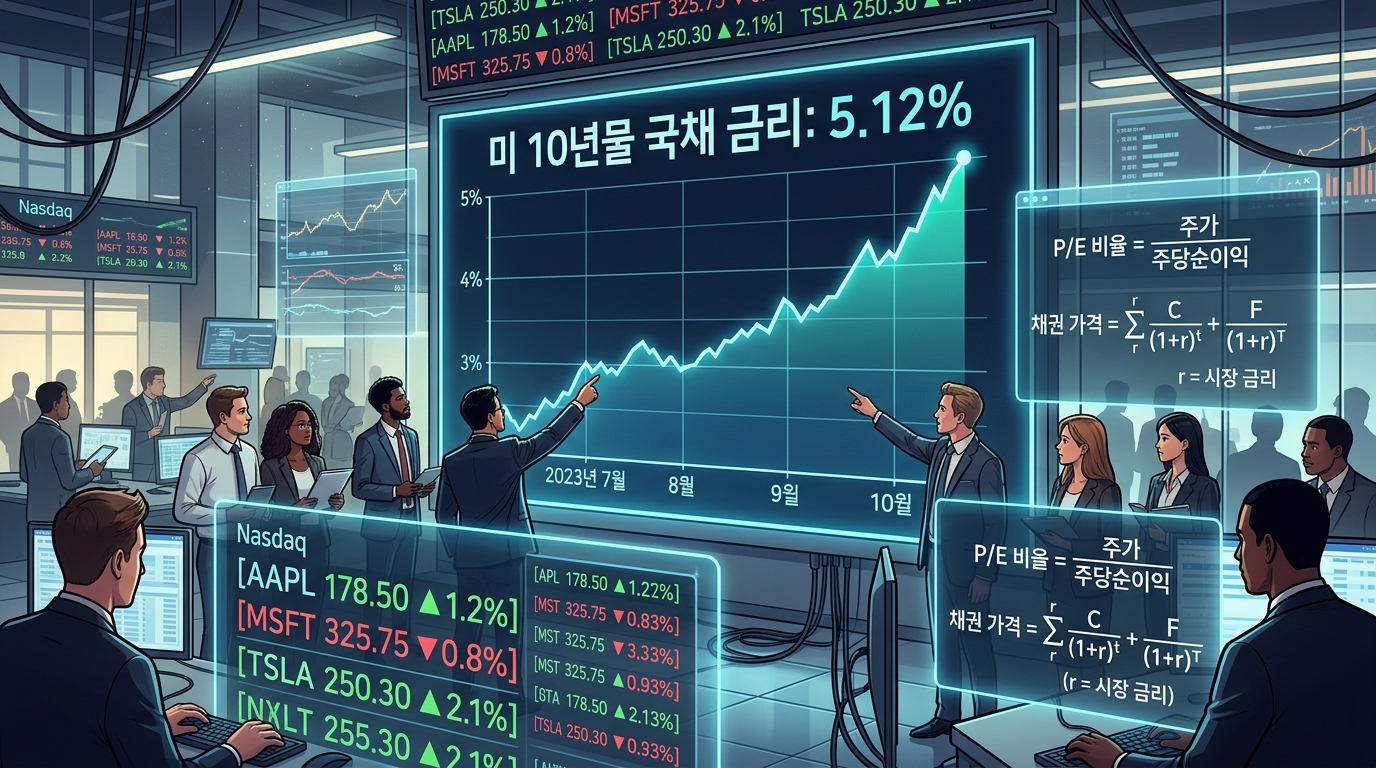
The US 10-year Treasury yield has crossed the 5.1% threshold once again, driven by resilient economic indicators and renewed concerns over inflation, intensifying discount rate pressure across global asset markets.
With long-term discount rates rising steeply, concerns are emerging that valuation multiple compression could become a reality for mega-cap Nasdaq tech firms that carry long cash flow duration.
Amid the time lag between massive capital expenditures (CapEx) in AI infrastructure and actual free cash flow (FCF) generation, narrowing the gap between earnings guidance and market valuations has emerged as the critical variable determining the direction of equity markets in the fourth quarter.
Current Market Overview
As of the morning session on September 28, 2026 (provisional), major global financial indicators are reacting sensitively to interest rate volatility.
The Nasdaq Composite is contending around the 27,068.72 level. In the South Korean market, the KOSPI is trading around 7,080.92, the KOSDAQ is at 844.48, and the USD/KRW exchange rate is hovering near 1,359.00 KRW based on intraday provisional data.
According to Daily Stock's proprietary Fear & Greed Index, sentiment in the Nasdaq market currently sits in the Fear territory at 37. While this represents a slight rebound from 30.4 (Fear) a week ago, it reflects a marked contraction compared to 59.6 (Neutral) one month ago and 50.7 (Neutral) three months ago.
In contrast, the KOSPI Fear & Greed Index currently indicates Neutral at 53.8, showing divergent behavior as it breaks out of the Fear phase (30.6) from a week ago and attempts a recovery toward the Neutral level (55.6) seen a month ago.
In the fixed-income market, the US 10-year Treasury yield has surged to around 5.17%, re-entering territory not seen since 2007, while the US Dollar Index (DXY) and the CBOE Volatility Index (VIX) are also experiencing concurrent upward pressure.
| Indicator | Value & Status (2026-09-28 Intraday Provisional) | 1 Week Ago | 1 Month Ago |
|---|---|---|---|
| Nasdaq Composite Index | 27,068.72 | - | - |
| KOSPI Index | 7,080.92 | - | - |
| KOSDAQ Index | 844.48 | - | - |
| USD/KRW Exchange Rate | 1,359.00 KRW | - | - |
| Nasdaq Fear & Greed Index | 37 (Fear) | 30.4 (Fear) | 59.6 (Neutral) |
| KOSPI Fear & Greed Index | 53.8 (Neutral) | 30.6 (Fear) | 55.6 (Neutral) |
| US 10-Year Treasury Yield | 5.17% (Latest confirmed) | Mid-4.90% range | Mid-4.60% range |
[이미지: /stdaily/uploads/202609/gen_6ab9ae33605707.22536756.png]
Financial Analysis
In the discounted cash flow (DCF) model used to evaluate growth stock valuations, the 10-year Treasury yield serves as the risk-free rate (Rf) and forms the cornerstone of the discount rate in the denominator.
When the discount rate climbs above 5%, the present value of earnings expected to be generated far in the future contracts sharply, triggering valuation multiple compression for high-growth tech companies.
Currently, mega-cap Big Tech companies enjoy balance sheet health that is incomparable to the dot-com bubble era, largely supported by robust cash reserves.
However, annual CapEx commitments reaching tens of billions of dollars for constructing hyperscale data centers and securing next-generation chips are putting short-term pressure on free cash flow.
While rising borrowing costs can cause an immediate liquidity crisis for lower-tier growth names, they pose a structural challenge for mega-cap tech in the form of declining Return on Invested Capital (ROIC).
Valuation Assessment
The 12-month forward price-to-earnings (Forward P/E) ratio of the Nasdaq 100 (NDX) currently stands in the 26x to 28x range, maintaining an elevated premium relative to historical averages.
Converting the inverse of the US 10-year Treasury yield into a bond "implied P/E" yields around 19x, narrowing the equity risk premium (ERP) relative to bonds toward historical lows.
Examining sensitivity across indices, the Philadelphia Semiconductor Index (SOX) and high-P/E software groups carry the longest duration, leading to wider multiple contractions during periods of rate rebounds.
Conversely, S&P 500 growth and platform companies with durable cash generation capabilities are seeing their valuation floors tested through shareholder return programs such as dividends and share buybacks.
Unless the upward revisions in earnings per share (EPS) estimates outpace the multiple contraction driven by rising discount rates, the index's upward momentum will inevitably remain constrained.
Expert & Institutional Insights
Major Wall Street investment banks analyze that the anchoring of long-term rates around 5% is fundamentally altering asset allocation strategies in equity markets.
Morgan Stanley noted that in an environment where risk-free 10-year Treasuries offer a guaranteed yield above 5%, the hurdle rate tech companies must overcome to justify excess returns has risen substantially.
On the other hand, more optimistic institutions, including Goldman Sachs, argue that outright concerns over multiple compression are overdone, citing Big Tech's dominant market power and the price-inelastic demand for AI infrastructure.
Nevertheless, a broad consensus of macroeconomic strategists points out that with the US Dollar Index (DXY) remaining firm and volatility (VIX) steadily establishing higher lows, an easing of concentration in market leaders and diversification into defensive assets become inevitable.
[이미지: /stdaily/uploads/202609/gen_6ab9ae3dd770b5.14450227.png]
Risk Factors
The primary fundamental risk is the scenario of prolonged monetary tightening by the Federal Reserve and the potential for additional benchmark rate hikes.
If downside rigidity in inflation metrics persists, pushing back market expectations for rate cuts and reviving tightening concerns, growth stock valuations would face direct headwinds.
A second risk is the potential delay in monetizing AI business models.
Even as Big Tech companies deploy astronomical CapEx, lower-than-expected paid subscription conversion rates and bottom-line contributions from the enterprise sector could compress operating margins.
A third factor involves FX translation losses on foreign revenue due to dollar strength, alongside mounting antitrust regulatory scrutiny on multinational IT corporations.
Investment Outlook & Strategic Takeaways
In a market environment where long-term Treasury yields fluctuate in the 5% territory, anticipating broad-based valuation multiple expansion is unrealistic.
Accordingly, tech portfolios moving forward are likely to favor selective positioning in companies that do not carry excessive valuation burdens and can demonstrate sustainable free cash flow (FCF) generation alongside pricing power.
With the Nasdaq Fear & Greed Index recording 37 (Fear), the current backdrop calls for patience—tracking guidance revisions throughout earnings season rather than engaging in emotional, short-term panic selling.
A prudent tactical response involves maintaining balanced cash allocations and planning phased entry scenarios until interest rate volatility stabilizes and visibility around earnings growth is reaffirmed.
Investor Checkpoint Q&A
Q1. Why are Nasdaq tech stocks more sensitive to increases in the US 10-year Treasury yield?
Growth stocks derive a significant portion of their intrinsic value from projected cash flows far into the future rather than current earnings. When the discount rate (the 10-year Treasury yield) climbs, distant future cash flows are discounted at a steeper rate when converted to present value, causing tech equities with long asset duration to face greater multiple compression than value stocks.
Q2. How does the current rate rebound differ from the dot-com bubble or the 2022 market downturn?
Unlike in past cycles, today's mega-cap tech leaders possess robust self-financing capabilities backed by substantial net cash positions and high operating margins. Consequently, the pressure stems from an adjustment in market expectations regarding return on investment (ROI) time horizons, rather than outright solvency or default risks tied to debt-servicing costs.
Q3. How does the interest rate sensitivity of the Semiconductor Index (SOX) compare to mega-cap growth stocks in general?
The semiconductor industry is a primary beneficiary of AI capital expenditures, which has elevated both its cyclicality and its valuation multiples simultaneously. During rapid rate spikes, concerns over CapEx retrenchment combined with profit-taking tend to induce relatively higher volatility compared to diversified mega-cap platform firms.
Q4. How does an elevated US Dollar Index (DXY) impact the earnings of Nasdaq Big Tech companies?
Leading US technology companies generate roughly 40% to 50% or more of their total revenues from overseas markets. A strong US dollar creates translation headwinds when foreign revenues are converted back into USD, while also constraining the IT procurement budgets of non-US enterprise customers.
Q5. In the current market sentiment environment (Fear phase), which indicators should investors monitor first?
With the Daily Stock Fear & Greed Index in the Fear phase at 37, investors should look beyond price declines alone and closely track whether upward momentum in the 10-year yield is abating, whether the VIX is stabilizing, and how Big Tech fourth-quarter CapEx plans and FCF margin trends unfold.