Hello, this is Daily Stock, delivering clear insights into key macroeconomic trends across global financial markets.
[이미지: /stdaily/uploads/202609/gen_6aad8a5a865f83.97094512.png]
Key Summary
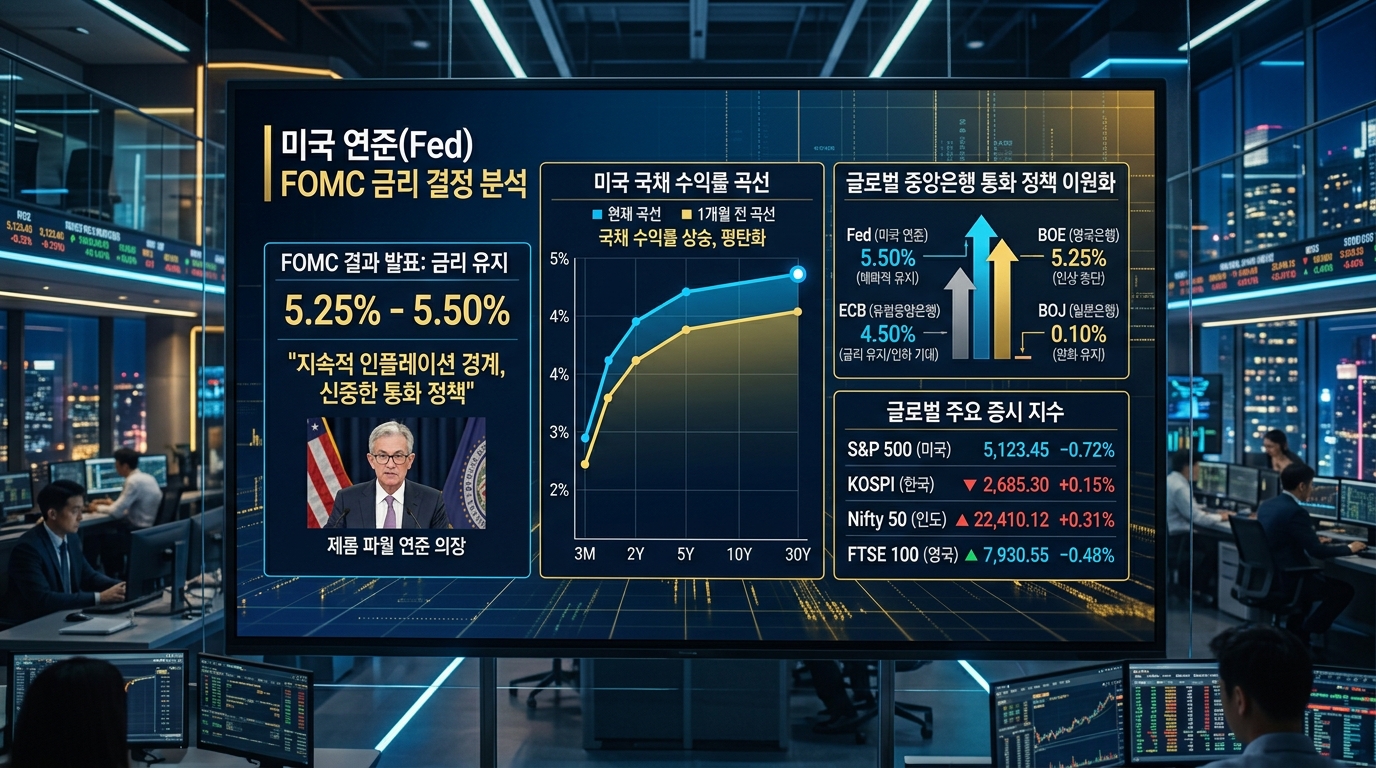
At its September meeting, the U.S. Federal Open Market Committee (FOMC) defined the pace of its monetary policy pivot following intense debate over the size of the benchmark interest rate cut.
The Federal Reserve's decision is viewed as a calculated move to strike a balance between defending against downside risks in the labor market and preventing a potential resurgence of inflation.
In the bond market, short-term yields faced moderate downward pressure reflecting the policy rate trajectory, whereas long-term Treasury yields displayed a divergent trend driven by term premiums and fiscal deficit burdens.
The global financial landscape has entered a phase where tri-polar decoupling is intensifying further, dictated by widening fundamental disparities across the United States, Europe, and Asia.
Market Overview
As of the close on September 19, 2026, global financial markets digested cross-asset volatility following the announcement of the FOMC outcome.
In the domestic market, the KOSPI closed at 6,894.23, the KOSDAQ at 827.12, and the U.S. NASDAQ Composite recorded 26,380.49.
The USD/KRW exchange rate closed at 1,389.00 KRW, reflecting the dollar's directional move tied to the scale of the rate cut.
According to Daily Stock's proprietary Fear & Greed Index, the KOSPI is currently in Neutral (40.9), slightly improving from Fear (28.2) one week ago, though cautious sentiment persists compared to Neutral (49.6) one month ago and Neutral (53.8) three months ago.
Conversely, the NASDAQ Fear & Greed Index stands in Fear (28.7), signaling a sharp contraction in risk appetite compared to Fear (32.7) one week ago, Neutral (54.6) one month ago, and Greed (66.5) three months ago.
The U.S. 2-year Treasury yield attempted to stabilize downward after pricing in the rate cut in advance; however, the 10-year Treasury yield faced downside rigidity due to soft-landing expectations combined with the burden of massive Treasury issuance, continuing the normalization (steepening) of the yield curve.
| Indicator / Index | 2026-09-19 Confirmed Value | 1 Week Ago | 1 Month Ago | 3 Months Ago |
|---|---|---|---|---|
| KOSPI | 6,894.23 | - | - | - |
| KOSDAQ | 827.12 | - | - | - |
| NASDAQ Composite | 26,380.49 | - | - | - |
| USD/KRW | 1,389.00 KRW | - | - | - |
| KOSPI Fear & Greed Index | Neutral (40.9) | Fear (28.2) | Neutral (49.6) | Neutral (53.8) |
| NASDAQ Fear & Greed Index | Fear (28.7) | Fear (32.7) | Neutral (54.6) | Greed (66.5) |
Financial Analysis
From a macroeconomic standpoint, U.S. federal debt management and Treasury issuance structures serve as key financial variables governing the monetary policy transmission channel.
As annual U.S. fiscal deficits remain persistently elevated, the U.S. Treasury's long-term debt auction volumes are testing the financial sector's absorption capacity.
While benchmark rate cuts lower short-term funding costs, long-term Treasuries tend to maintain issuance risk premiums (term premiums) due to heavy supply.
In terms of corporate financial health, interest coverage ratios for debt-dependent small- and mid-cap companies are projected to improve starting with this rate adjustment.
In contrast, Big Tech firms flush with substantial free cash flow (FCF) may experience a financial offsetting effect, as high-yield interest income generated from cash and cash equivalents declines.
[이미지: /stdaily/uploads/202609/gen_6aad8a66ad7558.52384809.png]
Valuation
Following the U.S. rate decision, valuation attractiveness across global equity markets reveals distinct divergence across the three key regions.
The U.S. S&P 500 and NASDAQ trade at 12-month forward price-to-earnings (Forward P/E) ratios that remain above historical averages, leaving the Equity Risk Premium (ERP) compressed relative to prevailing Treasury yield levels.
Meanwhile, European equities (STOXX 600) trade within a historical discount range at forward P/E multiples of 13–14x, reflecting the contraction in Eurozone manufacturing activity.
In Asian markets, South Korea and Taiwan display pronounced valuation divergence depending on exposure to the global AI semiconductor value chain, while Japan continues its price-to-book (P/B) re-rating process amid monetary normalization.
Chinese equities, despite low P/E appeal, face ongoing tests over whether structural discounts can be resolved, hinging on economic stimulus and the scale of liquidity injections.
Expert & Institutional Analysis
Global investment banks (IBs) offered mixed assessments regarding whether the September FOMC cut magnitude represents a preemptive response to avert recession or a lagging measure acknowledging accelerating economic deceleration.
Many experts are focusing on the terminal rate projected in the Summary of Economic Projections (SEP) and the dot plot rather than the rate cut increment itself.
Some bond strategists noted, "The reason long-term bond yields struggle to plunge in tandem with benchmark rate cuts is that term premiums revive unless there is an abrupt collapse in economic growth."
Meanwhile, macroeconomic institutions point out that policy divergence among central banks could spur foreign exchange volatility.
With the European Central Bank (ECB) accelerating its easing pace over slowdown concerns while the Bank of Japan (BOJ) pursues rate hikes, unwinding pressure on the yen carry trade and liquidity realignment across commodity markets are unfolding simultaneously.
| Region | Central Bank Stance | Manufacturing PMI Trend | Currency & Financial Environment Notes |
|---|---|---|---|
| **United States** | Gradual rate-cutting phase | Hovering around the 50 baseline | Yield curve normalization, Treasury supply burden |
| **Europe** | Stimulus-driven rate cuts | Below 50 (contraction phase) | Sluggish German manufacturing, energy cost uncertainty |
| **Asia (JP/CN/KR)** | JP: Seeking hikes / CN: Ongoing easing | Widening regional divergence | Yen appreciation pressure, Yuan stabilization & export supply-demand |
Risk Factors
The primary macro risk demanding vigilance is the disruption of commodity supply chains and a potential rebound in oil prices stemming from geopolitical conflicts.
If international crude oil prices (WTI, Brent) remain elevated per barrel due to instability across the Middle East and major producing nations, an energy-driven inflation resurgence could limit the pace of monetary easing.
Copper prices—a barometer for industrial metals—are also experiencing heightened volatility depending on global infrastructure demand and the strength of China's economic recovery.
Accumulated maritime freight rate increases and supply chain realignment costs could stall disinflation in core goods, stoking stagflation concerns.
Furthermore, trade tensions and tariff policy shifts among major economies could dampen global trade volumes, serving as a direct drag on export-driven Asian economies.
Investment Perspective
Following the September U.S. FOMC, investors should focus on the 'context and sustainability of the rate-cutting cycle' rather than the short-term event of the 'absolute cut magnitude.'
If labor market deceleration remains gradual, interest rate cuts are likely to translate into a soft-landing scenario that supports corporate earnings.
However, if long-term Treasury yields remain stubbornly elevated, discount rate pressures on highly valued growth stocks may not dissipate immediately.
Accordingly, rather than concentrating exposure in a single region, investors may consider diversification strategies spanning U.S. high-quality growth stocks, European dividend value stocks, and key Asian supply chain beneficiaries.
In a decoupling environment accompanied by commodity and FX volatility, maintaining risk management discipline through phased allocations during spikes in volatility remains a prudent approach.
[이미지: /stdaily/uploads/202609/gen_6aad8a7295a949.07091320.png]
FAQ
Q1. Why didn't Treasury yields decline across the board immediately after the September FOMC rate cut?
A1. Unlike short-term yields where rate cut expectations had already been priced in, long-term Treasury yields found downside support from a combination of resilient U.S. economic performance, term premiums driven by massive debt supply, and persistent federal deficit pressures.
Q2. How does monetary policy decoupling among the U.S., Europe, and Asia affect markets?
A2. With the U.S. Fed pursuing gradual easing, the ECB focusing on averting recession, and the BOJ eyeing policy normalization, shifting interest rate differentials among major nations heighten currency volatility and can trigger capital reallocations across global carry trades.
Q3. Why are oil and copper price trends critical in commodity markets?
A3. Surges in crude oil prices act as an inflationary risk factor by driving up import costs and complicating monetary easing, while copper prices serve as a leading economic indicator gauging global manufacturing health and investment demand across clean energy and power infrastructure.
Q4. What drove the NASDAQ Fear & Greed Index to record Fear (28.7)?
A4. Elevated valuation multiples for Big Tech firms, market skepticism regarding the return on investment (ROI) timeline for AI infrastructure, and discount rate burdens stemming from downside rigidity in long-term Treasury yields collectively weighed on investor sentiment.
Q5. What are the key macroeconomic indicators investors should monitor most closely going forward?
A5. Critical metrics to watch closely include U.S. nonfarm payroll additions and unemployment rate trends, global manufacturing Purchasing Managers' Indexes (PMI), and core Personal Consumption Expenditures (PCE) data reflecting central bank progress toward inflation targets.