Hello, this is Daily Stock, delivering precise analyses of key trends in domestic and global financial markets.
[Image: /stdaily/uploads/202607/gen_6a60084e23b788.12969428.png]
Key Summary
- The combined 2026 capital expenditure (CapEx) forecast for global Big Tech and Cloud Service Providers (CSPs) has been sharply revised upward to as much as $830 billion, far exceeding previous estimates.
- The market is focusing on the deceleration of core cloud (such as Azure) growth rates relative to astronomical investment costs, alongside shrinking free cash flow (FCF), driving a downward adjustment in stock valuation multiples.
- Dual supply chain bottlenecks—namely GPU operational delays caused by power grid shortages and inflation in core component prices—have emerged as key variables limiting Big Tech's Return on Invested Capital (ROIC).
Current Market Overview
As of midday on July 22, 2026 (tentative), the global technology stock market is experiencing severe growing pains due to a "decoupling" between record-high capital injections into artificial intelligence (AI) infrastructure and actual revenue growth rates of cloud platforms.
Today, the Nasdaq Composite stands at 25,837.21. According to Daily Stock's proprietary Fear & Greed Index, the Nasdaq is currently in "Neutral (41)" territory, indicating that investors are taking a cautious, wait-and-see approach ahead of upcoming earnings guidance.
Conversely, the KOSPI is at 7,110.32, marking "Extreme Fear (13)" as it reacts more sensitively to macroeconomic uncertainties, while the USD/KRW exchange rate continues to hover at a high level of 1,481.00 KRW.
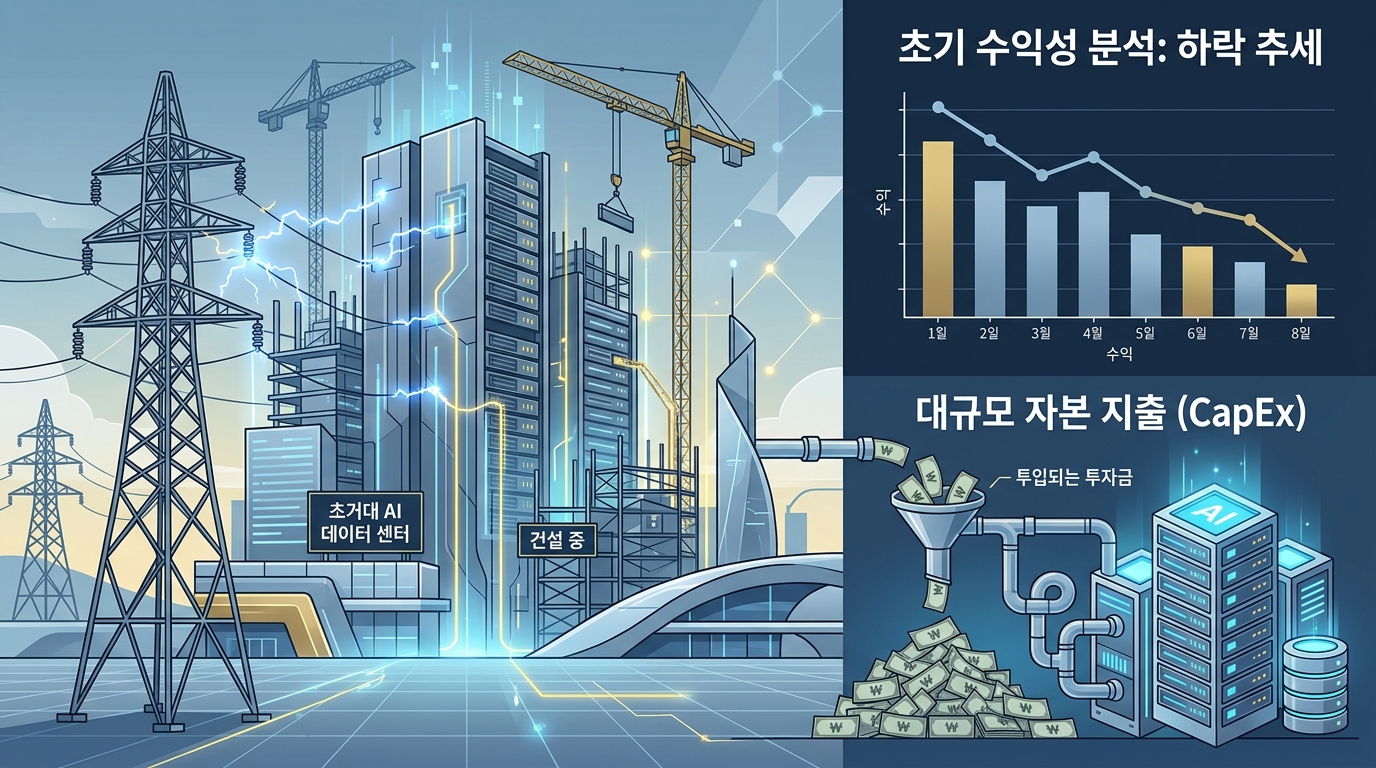
With Big Tech companies deploying approximately $130 billion in CapEx in Q1 2026 alone, market expectations are shifting rapidly from a simple "AI vision" to "Return on Investment (ROI) relative to costs."
Financial Analysis
A close look at the financial statements of major CSPs, including Microsoft (MSFT), reveals that CapEx intensity has soared to historic limits of 40% to 50% of revenue.
Notably, Microsoft raised its annual CapEx guidance for fiscal year 2026 to approximately $190 billion, a 61% surge year-over-year (YoY).
However, a source of growing financial strain is that roughly $25 billion of this increase is attributed to "component price inflation" rather than actual capacity expansion.
Meanwhile, quarterly growth for Azure, Microsoft's core cloud service, remains range-bound at 39% to 40%. The widening gap between growth rates and rising investment costs is putting downward pressure on FCF margins.
| Company | Projected 2026 Annual CapEx (USD) | YoY Growth | Latest Quarterly Cloud Growth | Key Highlights & Bottleneck Factors |
|---|---|---|---|---|
| **Microsoft (Azure)** | Approx. $190 billion | +61% | 40% (Constant Currency) | Power shortages leading to an $80 billion backlog of idle orders |
| **Alphabet (Google Cloud)** | $180B - $190 billion | +100%+ | 63% | Rapid growth driven by AI workloads; temporary decline in FCF |
| **Meta Platforms** | $125B - $145 billion | ~+85% | N/A (Internal use) | Offset by higher ad pricing, but infrastructure depreciation burdens are rising |
[Image: /stdaily/uploads/202607/gen_6a600857157722.29571906.png]
Valuation
The surge in Big Tech capital expenditure translates directly into heavier depreciation expenses, which are highly likely to cap operating profit margins (OPM) and earnings per share (EPS) growth over the coming quarters.
Microsoft's stock has corrected by about 18% so far in 2026, pulling its Forward P/E down to around 22x from historical peaks, illustrating a multiple de-rating process.
Unlike the dot-com infrastructure bubble of the past, the market acknowledges that actual revenues are being generated (such as Azure AI's annualized run-rate of $37 billion).
Nonetheless, there is strong wariness over the fact that FCF margins are eroding faster than market expectations.
Consequently, unless capital efficiency (ROIC) indicators show clear improvement in second-half guidance, additional downward pressure on valuations may materialize.
Expert & Institutional Analysis
Major Wall Street institutions, including Goldman Sachs, describe current AI infrastructure spending as "an unstoppable arms race rather than a controlled investment."
According to Goldman Sachs' analysis, global AI CapEx will hit $765 billion in 2026 and is projected to expand to $1.6 trillion annually by 2031.
In the short term, however, Big Tech companies face a structural shift where they may exhaust cash reserves and rely heavily on debt financing.
Market research firm TrendForce also notes that the combined CapEx of the top 9 global CSPs, including North America's top 5 hyperscalers and major Chinese players, has been revised upward to $830 billion this year, creating a structure where only supply chain equipment providers benefit early on.
Experts warn that the biggest wildcard for earnings will be the risk of idle assets—namely, storing GPU servers in warehouses but being unable to run them due to power transmission and distribution grid shortages (grid bottlenecks).
Risk Factors
First is the physical infrastructure bottleneck (power and components).
Despite holding nearly $80 billion in remaining performance obligations (RPO) for Azure, Microsoft cannot immediately boot up equipment due to power grid connection delays and surging lead times for high-voltage transformers (up to 128 weeks).
Second is core component price inflation.
With skyrocketing prices for high-bandwidth memory (HBM) and high-end AI accelerators like Nvidia's GB300, a significant portion of CapEx growth is being consumed by higher procurement costs rather than tangible capacity expansion.
Third is the delayed monetization of SaaS companies.
Unlike CSPs providing the underlying infrastructure, if enterprise software (SaaS) firms selling end-user services experience lower-than-expected AI monetization conversion rates, the broader demand for infrastructure could face a severe backlash.
Investment Outlook Summary
At this juncture, investors should not simply cheer for raw top-line growth in cloud revenues.
We have reached a phase where the resilience of free cash flow (FCF) relative to capital expenditures must be scrutinized.
In the short term, margin pressure is inevitable due to rising depreciation and component unit costs.
However, companies that can quickly convert their vast remaining performance obligations (RPO) into actual revenue will occupy a relatively advantageous position.
Therefore, in the upcoming second-half earnings season, a viable strategy would be to closely monitor each company's capital allocation efficiency and grid/power solutions while taking a staggered buying approach.
[Image: /stdaily/uploads/202607/gen_6a60085ede2455.90000355.png]
Investor Checklist Q&A
Q1. Is there any chance that Big Tech's AI CapEx will actually slow down?
A1. At present, because the cost of falling behind in the competition is far greater than the cost of investment, the arms-race style of spending is expected to persist. However, if power grid shortages and component price inflation become prolonged, spending may be forced into later periods due to physical constraints.
Q2. Why is a slight drop in cloud growth rates so critical to stock prices?
A2. The stock market has afforded very high valuation multiples to Big Tech. Thus, when a mismatch occurs—where investment growth rates (60-80%) outpace revenue growth rates (30-40%)—it triggers immediate downward pressure for valuation re-rating.
Q3. How severe is Microsoft's power grid bottleneck?
A3. There are cases where hundreds of thousands of high-performance GPUs have been secured and stored in warehouses, but cannot run for months due to a lack of power transmission capacity. In fact, lead times for critical transmission equipment like high-voltage transformers have stretched to over two years.
Q4. What is the secret behind Google Cloud's (GCP) solid performance in recent quarterly growth?
A4. Google relies less on external chip procurement due to a higher proportion of in-house developed accelerators (TPU v7/v8). Additionally, new inflows of AI workloads have risen steeply in the enterprise segment.
Q5. What indicator should retail investors prioritize most in this market phase?
A5. In future quarterly results, investors should prioritize analyzing the "CapEx-to-Operating Cash Flow" ratio and the speed at which Remaining Performance Obligations (RPO) translate into actual revenue.