Hello. This is Daily Stock.
[Image: /stdaily/uploads/202606/gen_6a2371706c5581.26941904.png]
Summary
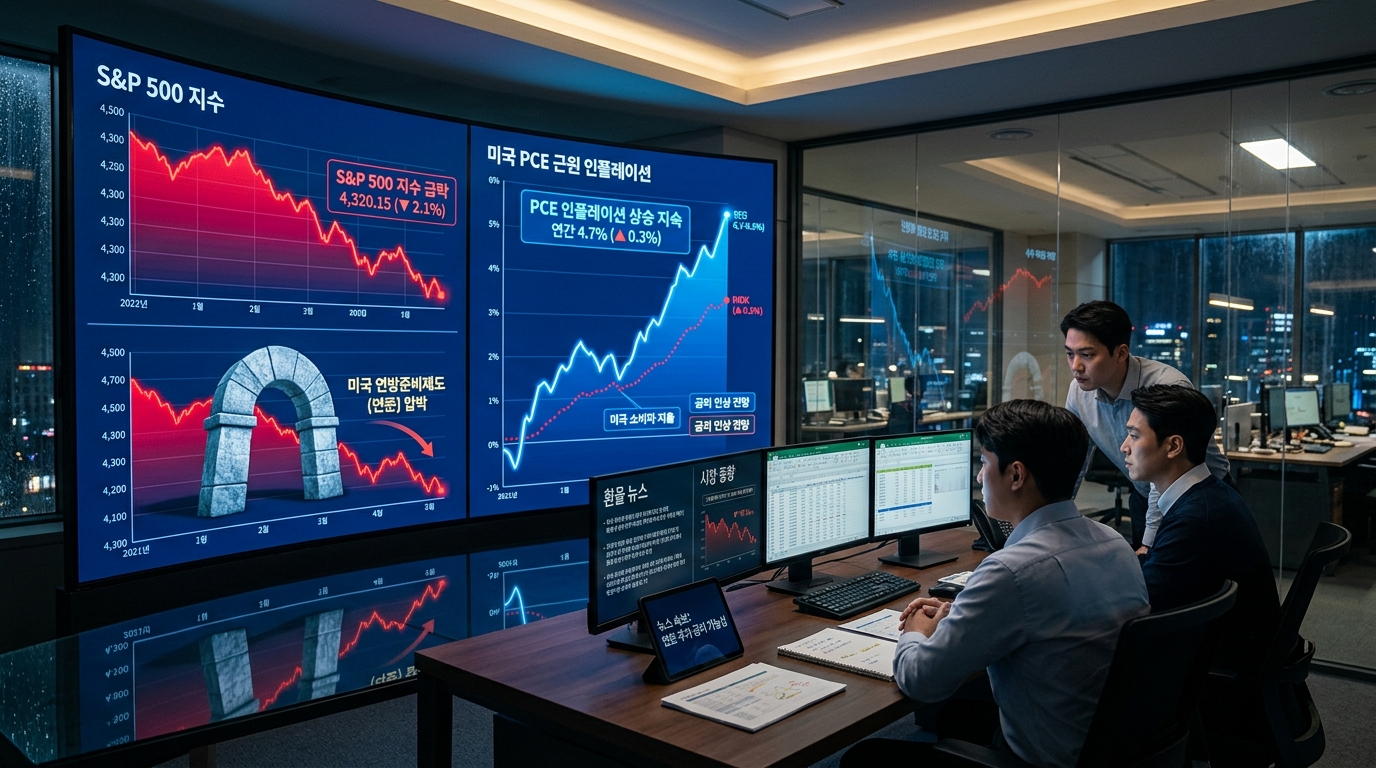
The US April PCE deflator rose 3.8% year-on-year, marking the hottest inflationary pressure in three years.
Combined with May nonfarm payrolls beating market expectations by more than double, hopes for a Federal Reserve rate cut have practically vanished.
The market is now on edge, starting to price in the possibility of an additional interest rate hike by the end of this year.
While the S&P 500 recently showed strength, surpassing the 7,600 level, caution is spreading as valuation multiples reach historical highs.
Current Situation Overview
Recently released US inflation indicators have reconfirmed that the path of disinflation is by no means smooth.
The April 2026 Personal Consumption Expenditures (PCE) price index, released by the US Bureau of Economic Analysis (BEA), rose 3.8% year-on-year.
This is the steepest increase since May 2023, driven directly by surging energy prices amid the ongoing war in Iran, which has lasted for four months.
[Image: /stdaily/uploads/202606/gen_6a23717b720597.50016317.png]
The Core PCE price index, which excludes volatile food and energy, also rose 3.3% year-on-year, proving the sticky nature of inflation.
Subsequently, May nonfarm payrolls increased by 172,000, vastly exceeding the market expectation of 80,000 to 88,000.
This jobs rally has complicated the Fed's monetary policy path, sending the US 10-year Treasury yield soaring past the 4.5% level once again.
Looking at the market sentiment indices, the Nasdaq Fear and Greed Index currently stands at Neutral (42.1).
The KOSPI Fear and Greed Index also remains in Neutral territory (51.8), indicating that investors are cautiously waiting to see how macroeconomic indicators unfold.
Financial Analysis
Despite the hot macroeconomic environment, the second-quarter earnings growth of S&P 500 companies appears robust on the surface.
Currently, the total earnings per share (EPS) growth rate estimate for S&P 500 companies in Q2 2026 is projected at approximately 21.2% year-on-year.
However, behind this spectacular figure lies an extreme concentration of earnings driven by a handful of mega-cap IT companies.
In fact, a whopping 17 percentage points of the Q2 earnings growth rate are generated solely by the information technology (IT) sector, which is leading a year-on-year growth of over 42%.
Excluding IT, the average earnings growth rate of the remaining 10 sectors is only around 11% to 12%, showing that the actual earnings health of the broader economy remains mediocre.
| Indicator | Recent Record | Key Characteristics & Significance |
|---|---|---|
| Headline PCE Deflator (YoY) | 3.8% | Reflects soaring energy prices due to the war in Iran |
| Core PCE Price Index (YoY) | 3.3% | Signal of persistent underlying inflationary pressure |
| May Nonfarm Payrolls | 172,000 | Double the market expectations (80,000 range) |
| 10-Year US Treasury Yield | 4.536% | Yields rebound on fears of prolonged monetary tightening |
| Atlanta Fed GDPNow (2Q) | 3.0% | Revised down from 3.8% due to slowing private consumption & investment |
| S&P 500 12-Month Forward P/E | 22.21x | Clearly overvalued compared to the long-term average (18.9x) |
Valuation
The S&P 500 index recently touched historic highs, fluctuating around the 7,600 level.
However, compared to the rising stock prices, valuation attractiveness has significantly deteriorated.
The 12-month forward price-to-earnings (P/E) ratio of the S&P 500 is currently overvalued at 22.21x.
This is well above the 5-year average of 19.9x and the 10-year average of 18.9x, presenting a constraint on further upside potential.
If high energy costs persist, household consumption power may decline, posing a risk of downward revisions to corporate earnings forecasts (EPS).
Expert & Institutional Analysis
Global investment institutions are increasingly raising warnings regarding market imbalances driven by momentum concentration.
Allianz Trade noted in a recent report, "The market is excessively pricing in an optimistic scenario of a Middle East conflict resolution in autumn."
They warned that if geopolitical conflicts persist alongside high oil prices, stagflation risks could emerge, leading to a market correction of nearly 20%.
JPMorgan also diagnosed that "the current rally is a concentrated market driven purely by earnings momentum," emphasizing the need for portfolio diversification.
They advised investors to remember the ultimate outcome of the Nifty-Fifty era, during which multiples were excessively inflated.
Risk Factors
The key risk to watch is the possibility of the real economy veering off a soft-landing path.
The Atlanta Fed's Q2 GDPNow estimate was recently lowered from 3.8% to 3.0%, reflecting a slowdown in private consumption growth.
[Image: /stdaily/uploads/202606/gen_6a237186264bf3.29809011.png]
With interest rates remaining high for longer and inflation failing to cool down, real disposable income of households is bound to keep shrinking.
According to the CME FedWatch, there is a 43% probability that the Fed might actually raise rates at the December FOMC, highlighting a high likelihood of prolonged monetary tightening.
This could increase refinancing costs for marginal firms and serve as a trigger for a credit crisis.
Investment Outlook Summary
While strong inflation and employment indicators demonstrate the short-term resilience of the US economy, they ultimately exert downward pressure on equity market multiples.
The S&P 500's rally, heavily concentrated in a few big tech companies, risks becoming a boomerang that amplifies downside market risks.
Investors should focus on risk management rather than relying entirely on index-tracking passive products.
Allocating assets to traditional energy and value sectors, which benefit from rising energy prices or boast stable cash flows, would be a viable alternative.
Investor Checklist Q&A
Q1. Why did the April Headline PCE deflator rise so sharply compared to the previous month?
A1. It was heavily impacted by soaring energy and commodity prices, including gasoline, due to ongoing military tensions in the Middle East.
Q2. Is an additional rate hike scenario by the Fed actually being discussed?
A2. With the May employment figures doubling expectations, the bond market is pricing in about a 43% chance of an additional rate hike within the year.
Q3. How high is the S&P 500's current forward P/E of 22.21x?
A3. It is overvalued by more than 17% compared to the long-term 10-year average of 18.9x, representing a significant valuation burden.
Q4. What does the downward revision of GDPNow imply?
A4. It indicates that US private consumption and investment stamina are gradually entering a slowdown phase under the weight of prolonged high inflation and high interest rates.
Q5. Which sectors look promising in a high-inflation, high-interest-rate environment?
A5. Traditional energy sectors that benefit from high oil prices, or high-dividend quality value stocks with low rate sensitivity and robust cash flows, could be advantageous.