Hello, this is the professional writer from Daily Stock.
Summary
The market capitalization of the domestic exchange-traded fund (ETF) market has surpassed the Kosdaq market for the first time in history, breaking into the 500 trillion won era.
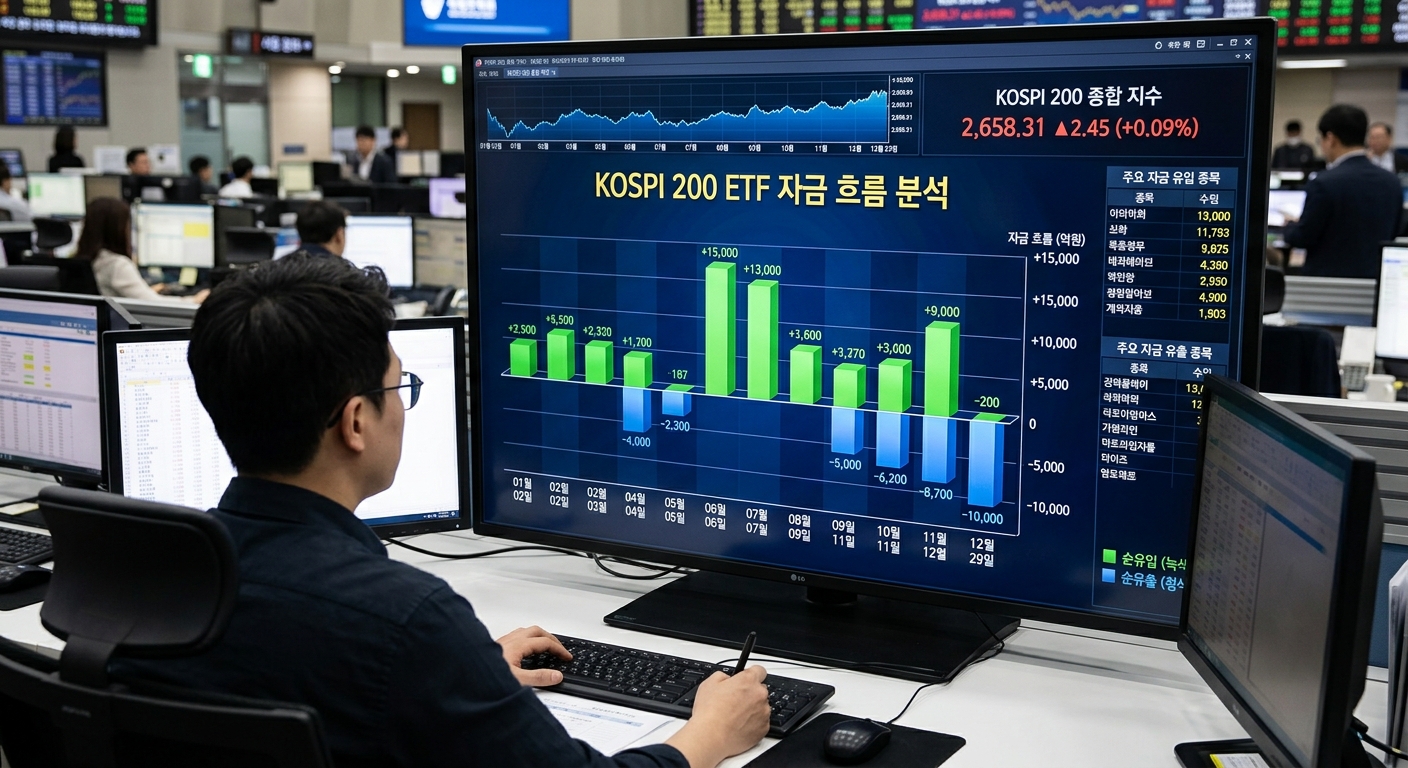
Amid this qualitative and quantitative growth, the fund flows of ETFs tracking the KOSPI 200—which represents South Korea's large-cap stocks—are diversifying as short-term profit-taking and dip-buying clash intensely.
Recently, as the KOSPI index slid to 8,411.21 points due to corrections in global tech stocks and a high USD/KRW exchange rate, temporary capital outflows occurred in large index ETFs, while retail dip-buying flowed into leveraged products.
In this analysis, we precisely diagnose the supply and demand trends of domestic and international KOSPI 200-related ETFs and examine response scenarios of institutional and foreign investors to fluctuations in the USD/KRW exchange rate.
[Image: /stdaily/uploads/202606/gen_6a40c6ec612df6.23868814.png]
Current Situation Summary
As of June 28, 2026, the market capitalization of the domestic ETF market reached 502.4556 trillion won, surpassing the Kosdaq market's capitalization of 478.7742 trillion won during the same period for the first time in history.
This is interpreted as a result of an accelerating "money move," where retail and retirement pension funds are shifting heavily into ETFs as systematic assets.
Conversely, the KOSPI index adjusted to 8,411.21 points, driven by the cooling of short-term overheating and the USD/KRW exchange rate continuing its high run at 1,538.00 won.
As a result, investor sentiment cooled slightly, causing the KOSPI to enter the "Fear (39)" stage according to its Fear & Greed Index, while the Nasdaq also pointed to a "Fear (24.8)" state.
In this environment, representative index products like the KODEX 200 experienced a net outflow of approximately 301.0 billion won, characterized by short-term profit-taking.
However, at the same time, the KODEX Leverage, which seeks a 2x return on the rising KOSPI index, recorded a net inflow of 316.3 billion won, showing that sideline capital aiming for an index rebound is fighting back.
Financial Analysis
The asset sizes and supply/demand characteristics of major ETFs tracking or linked to the KOSPI 200 can be summarized in the table below.
| ETF Name | Main Target Tracked | AUM Size & Characteristics | Recent Major Fund Flow Trends |
|---|---|---|---|
| **KODEX 200** | KOSPI 200 Index | Korea's largest index ETF and a key channel for institutional and foreign supply and demand | Net outflow of approximately 301.0 billion won in profit-taking during the recent index correction phase |
| **KODEX Leverage** | 2x Daily Performance of KOSPI 200 | A high-volatility product where retail investor funds seeking high returns are concentrated | Recorded a massive net inflow of 316.3 billion won recently due to perceived short-term oversold conditions |
| **iShares MSCI Korea (EWY)** | MSCI Korea Index | Representative overseas Korea investment ETF listed on the New York Stock Exchange | Recorded a single-day outflow of up to 600.0 billion won due to short-term profit-taking, but maintains historically high cumulative inflows for the year |
| **CSOP KOSPI 200 (Hong Kong)** | KOSPI 200 Index | First KOSPI 200-tracking ETF listed on another Asian stock market | Trading volume surpassed 30.0 billion won within 5 minutes of listing, accelerating capital inflows from the Greater China region |
Capital outflows from traditional index products are more indicative of portfolio rebalancing near the historical upper limits of the index rather than a simple avoidance of the market.
In addition, with the launch of new overseas-listed ETFs that increase accessibility to Korea for foreign investors, long-term fundamental supply and demand conditions are being solidly established.
Valuation
Currently, the 2027 consensus operating profit of the companies comprising the KOSPI 200 index is estimated to reach approximately 283 trillion won, a 31% increase compared to the previous year.
Of this, about 246 trillion won, or 87%, is concentrated in the semiconductor sector. Therefore, the direction of South Korea's large-cap valuations will likely depend on whether the IT sector maintains its current trajectory.
While concerns over short-term exchange losses are constraining foreign inflows as the USD/KRW exchange rate remains around the 1,538.00 won level, valuation attractiveness compared to historical averages remains strong.
Since Samsung Electronics and SK Hynix account for more than 60% of the index, the net asset value (NAV) of the ETFs is highly likely to recover quickly once earnings visibility for large semiconductor stocks is secured.
Expert and Institutional Analysis
Global investment banks (IBs) and major domestic brokerages suggest that the recent large-scale ETF capital outflows should not be viewed as a signal to "Sell Korea."
The massive short-term outflow from the US-listed iShares MSCI Korea ETF (EWY) is also analyzed as a natural breathing spell following the KOSPI's significant rally.
Asian institutions, including Hong Kong's CSOP Asset Management, attribute the rally in the South Korean large-cap market to the AI supercycle and still-attractive relative valuations.
However, they warn that unlike in the past, the emergence of high-leverage or inverse products targeting Korean large-caps in overseas markets could further intensify short-term supply-demand distortions.
South Korean asset managers are paying close attention to the trend where household funds and retirement pensions are driving the growth of the ETF market.
These passive and theme-driven capital inflows led by retail investors act as a buffer to support the downside during market declines, but they can also have the dual effect of fueling price imbalances during periods of heightened volatility.
Risk Factors
The most critical risk to monitor is the excessive concentration of the KOSPI 200 index in specific industries and stocks.
Because the IT and semiconductor sectors account for over 60% of the index, it remains vulnerable to simultaneous sharp declines if negative news—such as controversies over AI overinvestment by global Big Tech or drops in semiconductor unit prices—occurs.
Second is the pressure of foreign capital outflows as the USD/KRW exchange rate remains prolonged in the 1,530 won range.
If the high exchange rate structure becomes entrenched, it becomes difficult for foreign investors to protect their dollar-converted returns, making it highly probable that they will prioritize reducing their exposure to passive, large-cap index ETFs.
Finally, the surge in trading of high-volatility products, such as single-stock leveraged ETFs and futures-linked leveraged products, could stimulate the volatility index (VKOSPI), potentially triggering unwanted circuit breakers or sidecars.
[Image: /stdaily/uploads/202606/gen_6a40c6f64b6915.34564281.png]
Investment Perspective
In the short term, the KOSPI 200 ETF market faces a breathing spell due to internal and external volatility factors.
Although a short-term psychological contraction is inevitable as the Fear & Greed Index drops to 39, it is a time to avoid both unconditional optimism and pessimism, considering the mid-to-long-term improvement in earnings forecasts.
Rather than short-term plays using aggressive leveraged products, a strategy of accumulating index shares in installments while monitoring the resolution of global macroeconomic uncertainties may be effective.
In particular, it is necessary to refine portfolio adjustments by continuously checking exchange rate trends and improvements in export statistics for South Korean semiconductor large-caps.
FAQ
Q1. What is the main reason for the recent capital outflows from KOSPI 200 ETFs?
A1. This is because profit-taking and risk management selling emerged, centered on large index products, due to valuation controversies surrounding global Big Tech and the sudden surge in the USD/KRW exchange rate to 1,538.00 won.
Q2. What is the symbolic significance of the domestic ETF market cap surpassing the Kosdaq market?
A2. As of June 26, 2026, the ETF market cap (502 trillion won) surpassed the Kosdaq market cap (478 trillion won) for the first time. This proves that domestic investment trends have clearly shifted from direct investment in individual stocks to index and industry-themed ETFs.
Q3. How should the recent capital outflows from EWY, the representative Korea ETF listed in the US, be interpreted?
A3. Although a short-term capital outflow of over 600.0 billion won occurred in a single day—a historical high—the cumulative net inflows for the year remain at record highs. Thus, it is more natural to interpret this as a short-term portfolio adjustment rather than a trend reversal.
Q4. What is the impact of the CSOP KOSPI 200 ETF listed on the Hong Kong stock market?
A4. As the first product tracking the KOSPI 200 index listed on another Asian exchange, it provides a positive new channel for global institutions and Asian retail investors to support supply and demand without directly purchasing South Korean shares.
Q5. What macro indicators should be monitored most closely when investing in KOSPI 200 ETFs?
A5. Since the index is heavily skewed toward the semiconductor sector, the highest priorities should be given to monitoring US AI infrastructure investment demand, DRAM price trends, and whether the USD/KRW exchange rate stabilizes from the 1,500 won range.