U.S. West Texas Intermediate (WTI) crude oil inventories, which serve as a price compass for the global energy market, are drawing the attention of global financial markets by logging an unprecedented consecutive decline.
[Image: /stdaily/uploads/202606/gen_6a32ef265ac7e0.67397319.png]
Executive Summary
According to the latest release from the U.S. Energy Information Administration (EIA), weekly commercial crude oil inventories plummeted for the 10th consecutive week, adding supply pressure to the physical market.
In particular, total U.S. crude inventories, combining the Strategic Petroleum Reserve (SPR) and commercial inventories, shrunk to their lowest level since 1985—a 41-year low.
Nevertheless, international oil prices are trading in the high $70s per barrel, down about 30% to 40% from their recent peaks, driven by expectations of an upcoming interim peace agreement signing between the U.S. and Iran.
This article examines future oil price volatility scenarios under the U.S.-Europe-Asia three-pole decoupling, where tight physical supply and demand clash with macroeconomic downward pressure.
Market Overview
According to the EIA report released on June 17, 2026 (local time), U.S. commercial crude inventories fell by 8.3 million barrels from the previous week to 418.2 million barrels.
This nearly doubled the market expectation of a 4.6-million-barrel draw. Inventories at the Cushing, Oklahoma hub also fell by 1.6 million barrels to 20.03 million barrels, nearing their lowest levels since 2014.
[Image: /stdaily/uploads/202606/gen_6a32ef34a9cc00.19794181.png]
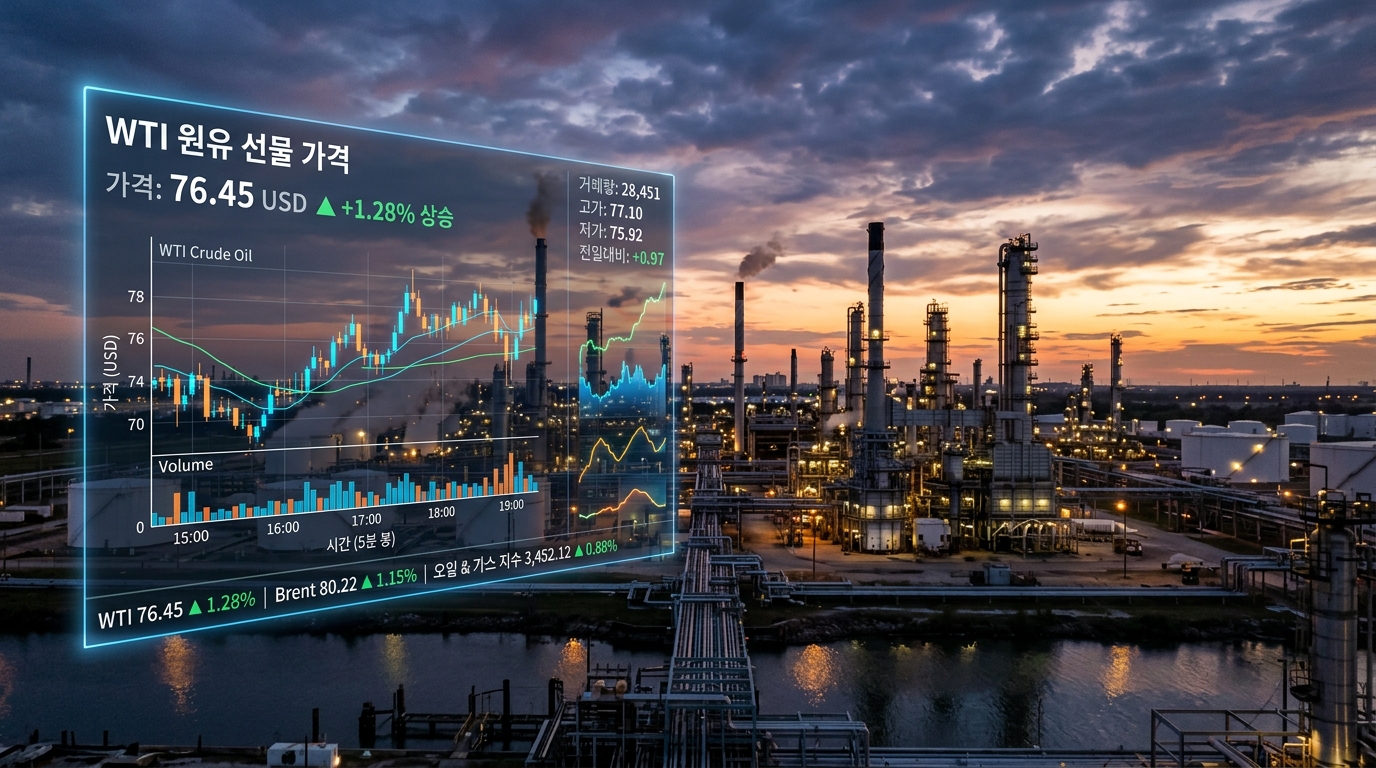
Despite the tight physical indicators in the crude oil market, WTI crude futures were trading sideways around $77.55 per barrel and Brent crude around $80.32 per barrel during intraday trading on June 18, 2026 (provisional).
At the same time, based on today's Korean intraday trading (provisional), the KOSPI index stands at 8864.24, the KOSDAQ index at 1031.96, and the Nasdaq index is moving around the 26373.40 level.
The USD/KRW exchange rate remains highly strong at the 1515.60 won level, continuing to increase the cost burden for domestic raw material importing companies.
Amid these changing financial environments, Daily Stock's own Fear and Greed Index clearly represents the mixed sentiment of market participants.
The KOSPI Fear and Greed Index currently stands at Neutral (53.6), recovering from Fear (32.2) a week ago, but still shows a strong wait-and-see attitude given the path of Neutral (55.4) one month ago and Fear (36.1) three months ago.
Conversely, the Nasdaq Fear and Greed Index is currently in Fear (39.5), rebounding only slightly from Fear (26.9) a week ago, and revealing that risk-off sentiment has deepened compared to Greed (63) a month ago and Neutral (57.4) three months ago.
Financial Analysis
The SPR, which serves as a financial buffer for the U.S. crude supply chain, saw an additional release of 8.9 million barrels over the past week.
As a result, total U.S. inventories fell by 17.2 million barrels in a single week to 758.5 million barrels, demonstrating that the nation's emergency response capabilities have been significantly drained.
On the other hand, U.S. refinery utilization rates rose by 1.4 percentage points to 96.7%, entering full operation mode to meet seasonal peak demand (driving season).
As refiners processed an average of 17.2 million barrels of crude oil per day in an effort to maximize gasoline production margins (crack spreads), the decline in crude inventories accelerated further.
Despite this high-intensity refining activity, average daily net crude oil imports in the U.S. actually fell by 241,000 barrels, fueling the rapid depletion of domestic crude oil.
Valuation
The current valuation of international oil prices can be summarized as a tug-of-war between "historical lows in physical inventories" and "scenarios of future supply increases."
U.S. commercial crude inventories remain about 6% below the five-year average, and Cushing hub inventories are practically near the minimum pipeline operating balance, firmly supporting the valuation floor.
However, expectations of the final signing of the interim peace agreement between the U.S. and Iran, scheduled for this Friday (June 19), are capping the long-term valuation upside of oil prices.
If the agreement takes effect, the immediate resumption of Iranian crude exports by sea and the normalization of the Strait of Hormuz would become possible, adding millions of barrels per day of new supply that is expected to offset the geopolitical price premium.
| Indicator | Weekly Change | Current Inventory/Utilization | Position Relative to 5-Year Average |
|---|---|---|---|
| U.S. Commercial Crude | -8.3M Barrels | 418.2M Barrels | Approx. 6% below |
| Strategic Petroleum Reserve (SPR) | -8.9M Barrels | 340.3M Barrels | Lowest level since 1983 |
| Cushing Hub Crude | -1.6M Barrels | 20.03M Barrels | Lowest bottom since 2014 |
| Refinery Utilization Rate | +1.4%p | 96.7% | Summer utilization peak territory |
Expert & Institutional Analysis
The U.S. Energy Information Administration (EIA), through its short-term outlook report, projected that global crude inventories would decrease by 6.3 million barrels per day in the second quarter and by 7.6 million barrels per day in the third quarter.
Due to this, it expressed concern that OECD crude inventories, centered on advanced countries, could reach their most vulnerable level in about 23 years since 2003.
In contrast, the International Energy Agency (IEA) presented a somewhat conflicting long-term scenario, warning in advance that the global market would face a massive oversupply in 2027 when supply chain bottlenecks are fully resolved.
Major investment bank (IB) experts also advise that although physical supply constraints exist, liquidation trading by speculative forces is driving prices down, making this a period of maximized short-term volatility.
Risk Factors
The most immediate risk is whether the US-Iran peace agreement is aborted or delayed in implementation.
The U.S. administration has been sending strong signals that it will resume airstrikes if the agreement is not complied with. If any friction arises over the weekend, the market could instantly price in supply shortage concerns, triggering a spike in oil prices.
Weather volatility is also considered a wildcard. If a tropical depression currently developing near offshore oil wells in the Gulf of Mexico escalates into a hurricane, there is a pervasive risk of temporary physical shutdown impacts on U.S. offshore crude production facilities.
From an Asian market perspective, if raw material oil prices bounce back because they cannot withstand the pace of inventory depletion amid a high exchange rate (1515.60 won) environment, it could directly worsen the stagflation risk of emerging Asian indices.
Investment Perspective
The strong domestic fundamentals of the U.S. rapidly drawing down its crude inventories contrast sharply with Europe's manufacturing contraction and Asia's energy import inflation burden.
While the current collapse in physical inventories confirms a long-term support line, investors must continuously monitor diversifying supply chain normalization scenarios, such as the actual effectiveness of the peace agreement and offshore wind speeds in the Gulf of Mexico.
Investor Checklist Q&A
Q1. What is the fundamental reason why U.S. commercial crude inventories have been plummeting for so long?
A1. Amid global geopolitical tensions, imports of U.S. crude oil as an alternative source have surged, and refiners have maximized facility utilization rates to meet the spike in summer transportation demand.
Q2. What does the decline in the Strategic Petroleum Reserve (SPR) balance mean for the market?
A2. Although the surge in oil prices was temporarily suppressed through the depletion of stockpiles, the safety cushion, which has dropped to 1980s levels, implies that emergency price response tools will face limits in the event of unexpected future shocks.
Q3. Why are international oil prices currently about 30% lower than in spring, even though inventories are near rock bottom?
A3. Rather than physical supply-demand balances, as the scheduled signing date (June 19) of the interim agreement between the U.S. and Iran approaches, the inflow of global seaborne crude and the resumption of transportation networks have been priced in, temporarily draining the geopolitical risk premium.
Q4. How is the US-Europe-Asia three-pole decoupling manifesting in the commodity market?
A4. The U.S. is supporting its energy security index with unprecedentedly tight supply and demand. Meanwhile, slow-growing Europe is seeing demand slow, and Asia is carrying the full cost burden under high USD/KRW exchange rate conditions, showing a polarized state.
Q5. What key indicators should we focus on to determine the future direction of oil prices?
A5. We must monitor in real-time whether Iranian crude exports actually rebound after the peace agreement is signed this weekend, and whether refining production is delayed due to worsening weather near the Gulf of Mexico.