Hello.
This is Daily Stock, delivering verified data and in-depth analysis.
Today, June 2, 2026, domestic and international financial markets are moving cautiously, closely watching the direction of macroeconomic indicators.
Today, the KOSPI closed at 8,801.49, the KOSDAQ at 1,026.03, while the Nasdaq stands at 27,086.81, and the USD/KRW exchange rate is at 1,517.50 won.
According to Daily Stock's proprietary Fear & Greed Index, the current KOSPI Fear & Greed Index points to Neutral at 59.1, compared to Neutral (58.1) a week ago, Greed (75) a month ago, and Neutral (40.3) three months ago.
The Nasdaq Fear & Greed Index also remains in the Neutral phase at 59, showing slightly calmer investment sentiment compared to Greed (60.9) a week ago, Greed (71.2) a month ago, and Greed (62.4) three months ago.
[Image: /stdaily/uploads/202606/gen_6a1e85b7445467.07929017.png]
Key Highlights
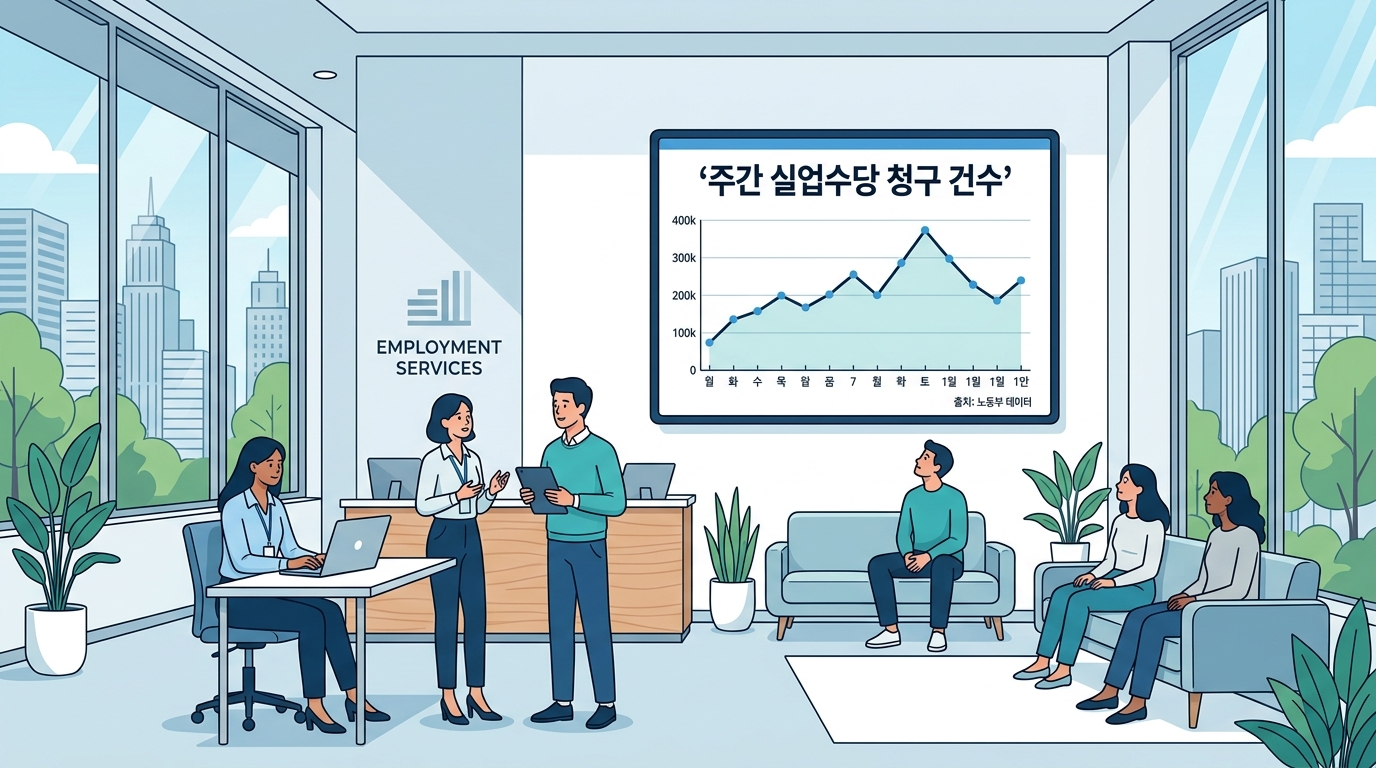
* Slight Increase in Jobless Claims: Weekly initial jobless claims in the US came in at 215,000, slightly exceeding the market expectation of 213,000.
* Dichotomy in the Labor Market: While initial claims—reflecting mass layoffs—remain stable, continuing jobless claims rose to 1.786 million, indicating that the duration of job searches is lengthening.
* Rising Inflationary Pressures: Driven by a surge in oil prices from Middle East conflicts, April PCE inflation spiked to 3.8%, bolstering the case for the Federal Reserve to keep interest rates higher for longer.
* Growth Forecast Downgraded: Amid slowing consumer spending and manufacturing indicators, the Atlanta Fed's GDPNow forecast for Q2 was downgraded to 3.0%.
Summary of Current Situation
According to the US Department of Labor, initial claims for state unemployment benefits rose by 5,000 to a seasonally adjusted 215,000 for the week ended May 23.
While this is slightly higher than the market consensus of 213,000, it remains within a historically stable range in the low 200,000s.
However, continuing claims—the number of people receiving benefits after an initial week of aid—rose by 15,000 to 1.786 million for the week of May 10–16.
This suggests that while layoffs are not spiking, it is taking longer for those who lose their jobs to find new employment.
The 4-week moving average, which smooths out week-to-week volatility, also edged up by about 6,300 to 209,000, starting to outline a gradual upward trend.
Overall, while subtle signs of cooling are detected, the labor market does not show the sharp contraction that would prompt the Fed to immediately cut interest rates.
Financial Analysis
From a macroeconomic perspective, the robust labor market has served as a sturdy pillar supporting the consumption power of US households.
However, detailed economic indicators released recently warn that household financial resilience is gradually depleting.
The Atlanta Fed's GDPNow real-time growth forecasting model downgraded its estimate for Q2 GDP growth from 3.8% to 3.0%, reflecting a slowdown in consumer spending and a decline in net exports.
With the personal saving rate falling sharply, analysis shows that households are relying heavily on savings to withstand high inflation and elevated interest rates.
The table below outlines the details of recent key US employment and macroeconomic indicators along with market interpretations.
Key US Macroeconomic and Employment Indicators (As of late May 2026)
| Classification | Actual | Previous / Forecast | Key Implications & Market Interpretation |
|---|---|---|---|
| **Initial Jobless Claims** | 215,000 | 210,000 (Prev) / 213,000 (Forecast) | Slightly higher than expected but remains at historically low levels |
| **Continuing Jobless Claims** | 1.786 million | 1.771 million (Prev) | Indicates a slowing job search process and potential re-employment difficulties |
| **4-Week Moving Average** | 209,000 | 202,750 (Prev) | Slight upward trend in unemployment after smoothing short-term noise |
| **April PCE Inflation (YoY)** | 3.8% | 3.5% (Prev Month) / 3.7% (Forecast) | Hit a 3-year high due to surging oil prices from Iran conflicts |
| **Q2 GDPNow Growth Forecast** | 3.0% | 3.8% (As of mid-May) | Captures economic cooling signals due to declining consumer spending |
Valuation
The 12-month forward price-to-earnings (Forward P/E) ratio for the S&P 500 is currently hovering around 21.2x.
This is significantly higher than both its 5-year average of 19.9x and its 10-year average of 18.9x, indicating a valuation range that carries notable pressure.
While corporate earnings per share (EPS) estimates are being revised upward thanks to a resilient job market, it may be difficult to justify current multiples if interest rates remain anchored at elevated levels.
In particular, earnings growth from mega-cap tech stocks leading the AI sector is driving the index's overall multiple, accentuating a valuation polarization between large-cap and small-cap stocks.
Going forward, the success of valuations will depend on whether inflation can be brought under control without triggering a sharp spike in jobless claims.
If a "Goldilocks" scenario—where the labor market remains strong while prices stabilize—is compromised, a valuation reset in the equity market will be inevitable.
[Image: /stdaily/uploads/202606/gen_6a1e85b88542b4.72596741.png]
Expert & Institutional Analysis
Global investment banks and macro experts agree that the latest jobless claims data will serve as justification for the Fed to push back the timing of rate cuts.
With no indicators pointing to a collapse in employment, there is little reason for the Fed to pre-emptively ease monetary policy.
The chief economist at Fitch Ratings noted that while the Fed cannot directly address supply chain shocks, it cannot ignore the pass-through of core inflation amidst persistent upward price pressures.
The combination of employment stability and high inflation serves as a strong argument for maintaining a restrictive stance.
Bloomberg Economics analyzed that, apart from corporate restructuring related to AI transitions in tech companies, large-scale layoffs have not materialized across the broader US economy.
Therefore, they predict a soft landing—where growth moderates as the economy gradually absorbs the shock of high rates—is more likely than a sudden hard landing.
Risk Factors
[Image: /stdaily/uploads/202606/gen_6a1e85d5bd1ee9.88960768.png]
First, there is the risk of energy and commodity prices spiraling out of control as the blockade of the Strait of Hormuz due to conflicts with Iran becomes prolonged.
A spike in oil and gasoline prices directly erodes household purchasing power and fuels headline inflation, forcing the Fed to keep rates frozen for an extended period.
Second, there are concerns about the qualitative deterioration of employment as entry barriers rise for new job seekers and college graduates.
If major companies slow down hiring for full-time positions and rely mostly on temporary workers, the fundamental strength of domestic consumption could gradually erode even if the headline unemployment rate remains low.
Lastly, there is the refinancing and credit risk of marginal companies as their debt matures under high interest rates for longer.
Given the lagging nature of employment indicators, if marginal companies begin to default due to refinancing failures, there is a risk of a non-linear shock where unemployment figures deteriorate rapidly.
Investment Perspective Summary
US weekly initial jobless claims show no signs of a sudden crack in the labor market, reflecting the resilience of the US economy.
However, the reality that this forces the Fed to maintain restrictive high interest rates for longer acts as a double-edged sword for the stock market.
Therefore, it may be valid for investors to review their exposure to high-growth stock portfolios with demanding valuation multiples, and take a conservative approach by diversifying a portion of their assets into high-dividend quality stocks or consumer staples sectors that possess robust cash flows and pricing power.
As the official May employment report, scheduled for release on June 5, will be a major milestone determining the future path of interest rates and the US dollar, a careful strategy of avoiding excessive leverage and adopting a wait-and-see stance is recommended until the data is confirmed.
Investor Checklist Q&A
Q1. Is it bad news that weekly initial jobless claims came in higher than expected?
A1. While it slightly exceeded expectations, it remains at historically low levels in the low 200,000s, so it is hard to view it as bad news. Rather, because it suggests the labor market is cooling gently instead of running too hot, it has a positive aspect that could alleviate the Fed's tightening intensity.
Q2. What does the slight increase in continuing jobless claims mean?
A2. It indicates that people who lose their jobs are not finding new ones immediately, leading to longer job-hunting periods. This can be interpreted as companies avoiding mass layoffs but raising the bar for new hires.
Q3. Why did April PCE inflation rise to 3.8%?
A3. It was heavily influenced by a surge in oil and energy prices as transit through the Strait of Hormuz was restricted due to geopolitical conflicts involving the US, Israel, and Iran. Combined with the strong labor market, this is the biggest obstacle hindering the path toward lower inflation.
Q4. Based on the trend of jobless claims, when is the Fed expected to cut rates?
A4. With employment holding up strongly and inflation accelerating in the high-3% range, a rate cut in the near term seems unlikely. Experts are increasingly viewing a cautious scenario where the Fed prolongs high rates into next year as highly probable.
Q5. What strategy should individual investors take with the S&P 500 forward P/E exceeding 21x?
A5. Since valuations are somewhat expensive compared to historical averages, it is safer to approach via dollar-cost averaging rather than overallocating into index-tracking products. It is recommended to mix in defensive portfolios focused on short-term bonds that benefit from high interest rates or value stocks with strong cash generation.