
Hello, this is Daily Stock, delivering key insights into global financial markets.
Executive Summary
As the US presidential election collides with major tech earnings reports, the Nasdaq Volatility Index (VXN), which reflects tech-focused implied volatility, is rising sharply.
Market skepticism regarding the pace of cash return relative to Big Tech's massive artificial intelligence (AI) capital expenditures (CAPEX), combined with renewed upward pressure on the 10-year US Treasury yield (US10Y), is compounding valuation burdens on tech stocks.
Rather than simply raising cash, investors are focusing on sophisticated hedging positions utilizing put option spreads, diversification into the S&P 500 relative to the Nasdaq 100, and short-term volatility instruments.
Current Market Snapshot
As of intraday trading on October 28, 2026 (tentative), the Nasdaq Composite stands at 26,477.81, while the USD/KRW exchange rate continues to fluctuate around 1,327.50 KRW.
In the South Korean domestic market, heightened volatility prevails, with the KOSPI recording 5,786.75 and the KOSDAQ at 756.09.
According to Daily Stock's proprietary Fear & Greed Index, sentiment in the Nasdaq market currently remains in the "Fear (33.6)" zone.
Although this reflects a slight rebound from "Fear (28.7)" a week ago, it remains below the levels seen one month ago at "Fear (36.9)" and three months ago at "Fear (37.3)," indicating that risk-averse sentiment toward growth assets remains heavily embedded.
Domestic Korean equities also reflect macro uncertainty, with the KOSPI Fear & Greed Index registering "Extreme Fear (10.1)," barely changed from "Extreme Fear (9.6)" one week prior.
Financial Analysis
The fundamental trigger behind the recent expansion in Nasdaq volatility is directly tied to aggressive AI CAPEX trends among Big Tech firms.
While hyperscalers' quarterly infrastructure investments continue to break all-time highs, caution is spreading that operating margin improvements guided in earnings reports may fall short of elevated expectations.
Compounding this, the strength of the US Dollar Index (DXY) and the 10-year US Treasury yield (US10Y) threatening previous highs are pushing up discount rates applied to future cash flows of growth stocks.
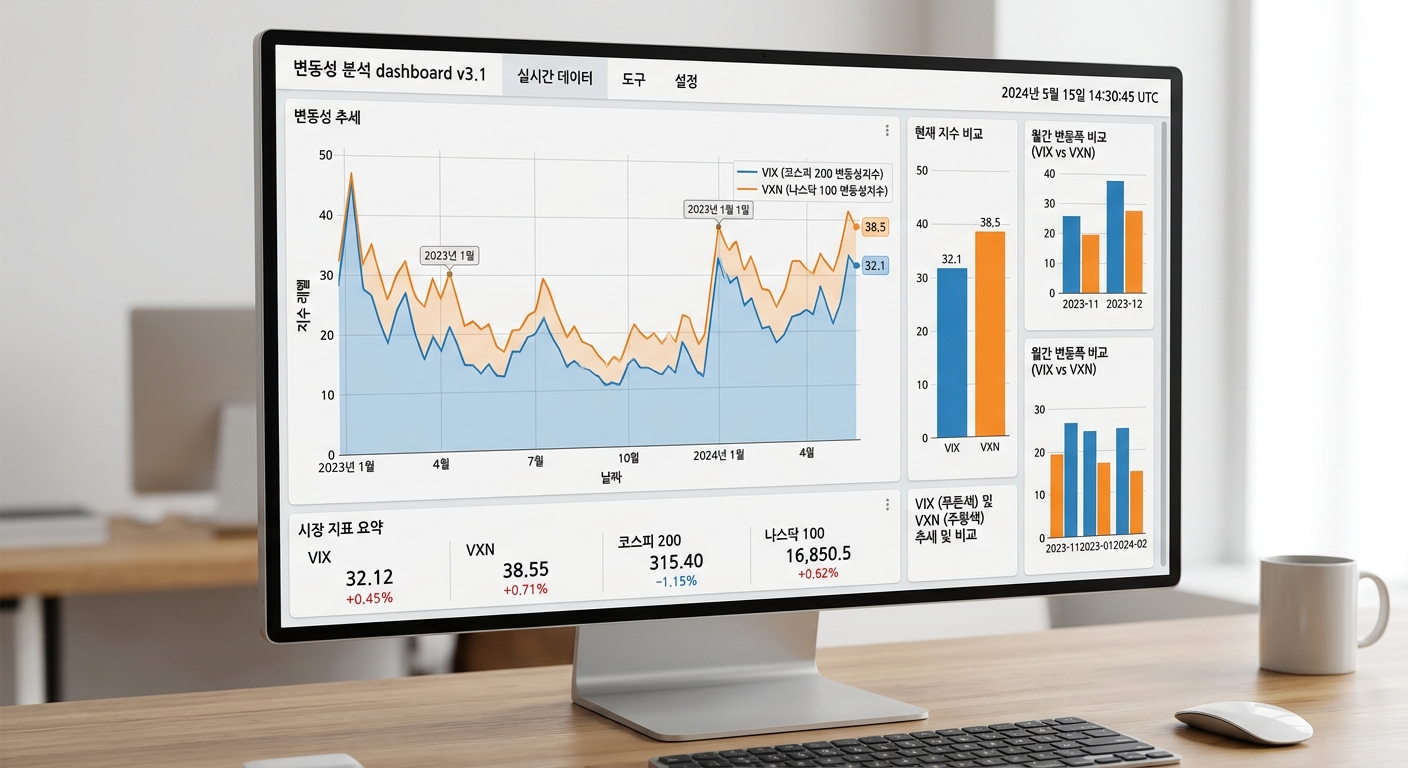
The Nasdaq 100-based VXN index is climbing at a significantly steeper rate than the CBOE VIX index—which reflects the implied volatility of the S&P 500—widening the spread between the two indices.
This demonstrates that market participants' anxiety is concentrated specifically on earnings sustainability within the tech and semiconductor sectors rather than broad macroeconomic conditions alone.
| Indicator | Observed Level & Market Condition | Impact on Tech Value Chain |
|---|---|---|
| **Nasdaq Fear & Greed Index** | Currently 33.6 (Persistent Fear Zone) | Subdued investor sentiment & valuation multiple compression pressure |
| **KOSPI Fear & Greed Index** | Currently 10.1 (Extreme Fear Zone) | Slowdown in foreign capital inflows tied to global risk aversion |
| **US10Y Treasury Yield** | Widening upside volatility | Upward pressure on discount rates, weighing on high-multiple tech valuations |
| **Big Tech CAPEX Cycle** | Continued expansion in AI data center investments | Near-term free cash flow (FCF) slowdown and monetization test |
| **VXN vs. VIX Spread** | Widening tech implied volatility premium | Concentration of downside protection demand for the Nasdaq 100 |
Valuation
The 12-month forward price-to-earnings (Forward P/E) ratio for the Nasdaq 100 is currently positioned near the upper end of its historical average, leaving it structurally vulnerable to interest rate and earnings shocks.
Multiples across the Philadelphia Semiconductor Index (SOX) and large-cap software platform companies are reacting with heightened sensitivity to interest rate fluctuations.
Specifically, a co-movement pattern has emerged where every 10-basis-point move in the 10-year US Treasury yield triggers an above-average repricing of multiples for Nasdaq growth equities.
The moderating relative strength of the Nasdaq 100 compared to the S&P 500—which carries a higher weighting of traditional value and defensive stocks—can also be interpreted as an ongoing process of easing valuation burdens.
Expert & Institutional Analysis
Major Wall Street derivatives strategists attribute this surge in VXN to a concentrated wave of hedging demand bracing for the dual shocks of "presidential election political risk" and "peak earnings reporting season."
Depending on election outcomes, antitrust regulations targeted at Big Tech, power grid support policies for AI data centers, and the intensity of semiconductor subsidies and export controls could undergo drastic realignments.
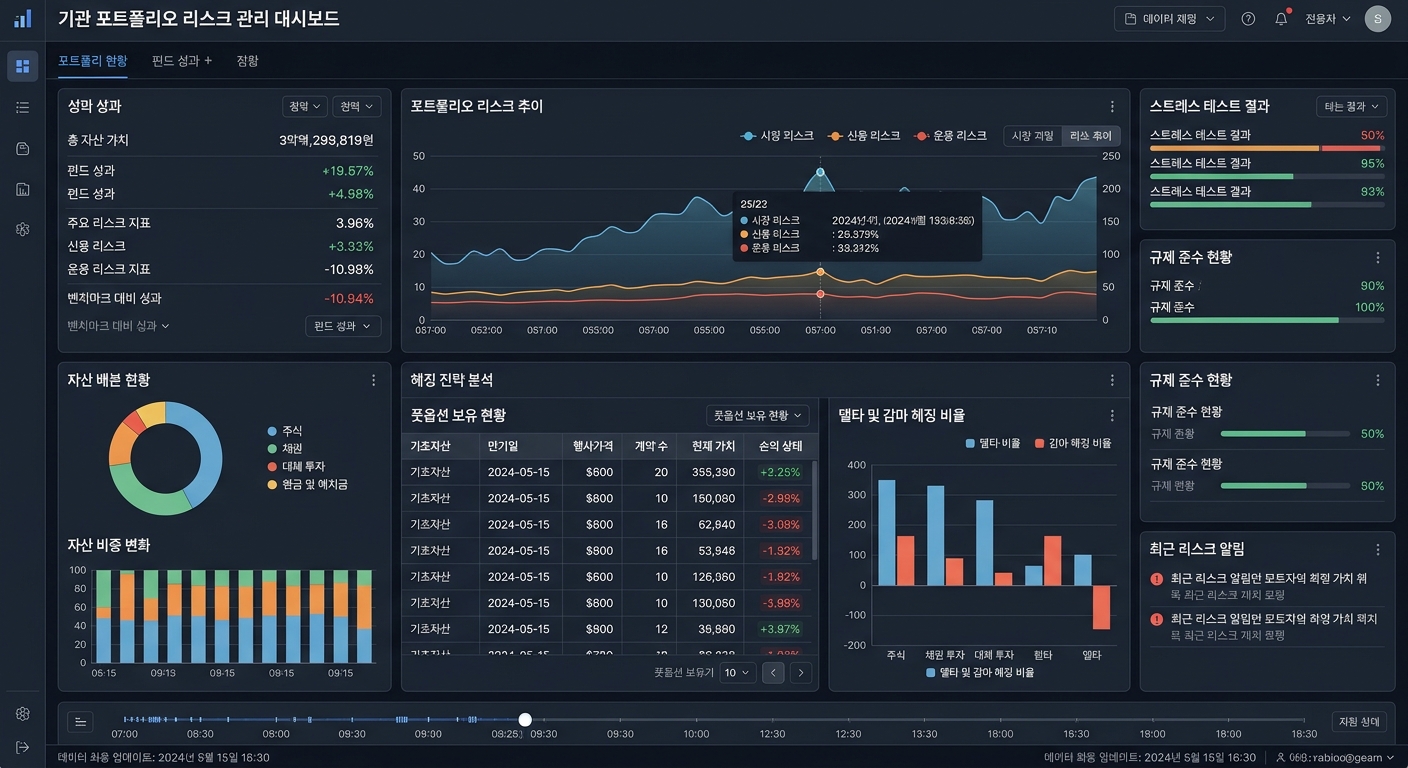
Rather than outright cash liquidation, institutional investors are actively deploying put spread structures and collar strategies combining long put options with short call options.
With an eye on the "volatility crush"—where implied volatility drops sharply following earnings announcements—there is a noticeable trend of structuring hedge expirations just past the presidential election.
Risk Factors
The primary downside risk centers on the potential delay in monetization relative to corporate AI infrastructure investments.
If astronomical capital outlays fail to convert into tangible operating profit growth, multiple compression across the broader Big Tech sector will be unavoidable.
Second is regulatory risk under the incoming administration; tighter antitrust oversight on platforms and expanded export controls on cutting-edge chipsets could substantially raise supply chain costs across the global semiconductor value chain.
Lastly, delayed Federal Reserve rate-cut trajectories resulting from lingering inflation remain an ongoing risk factor, complicating the defense of premium multiples on growth stocks.
Investment Perspective Summary
During periods of elevated volatility directly ahead of a US presidential election, maintaining balance across asset allocation is preferable to aggressive directional bets.
Investors holding excessively concentrated single-asset tech allocations may find it prudent to flexibly build cash reserves or diversify into defensive dividend-growth equities.
For investors with access to derivatives, out-of-the-money (OTM) put options can serve to hedge tail risks; however, rollover costs must be monitored closely when holding long volatility index positions.
With intraday (tentative) indicators confirming that market sentiment remains in the Fear zone, conservative positioning management is recommended until election outcomes and key corporate earnings are fully digested.
Q&A with Daily Stock
Q1. What is the specific difference between the VIX and the VXN?
The VIX is a 30-day implied volatility measure calculated using S&P 500 index options, whereas the VXN measures implied volatility derived from Nasdaq 100 index options. Consequently, the VXN reflects market fear and hedging demand targeting mega-cap tech stocks—such as Apple, Microsoft, and NVIDIA—with far greater sensitivity.
Q2. Why do volatility indices frequently spike right before a US presidential election?
Policy uncertainty reaches its peak, spanning potential corporate tax adjustments, tech antitrust scrutiny, and trade tariff shifts depending on the election outcome. As institutional investors purchase put options en masse to shield portfolios against sudden drawdowns, option premiums (implied volatility) spike temporarily.
Q3. How are Big Tech earnings releases correlated with the surge in VXN?
Leading up to earnings releases, hedging flows aimed at mitigating earnings misses cause the VXN to rise continuously. However, once earnings announcements and the election conclude, the removal of uncertainty can trigger a "volatility crush," where option values decline precipitously.
Q4. What practical hedging methods are readily accessible to retail investors?
If futures and options trading are unsuitable, raising allocations to short-term Treasury ETFs or cash remains the safest hedge. Additionally, rotating a portion of high-beta single tech holdings into lower-volatility sector ETFs, such as healthcare or utilities, serves as an effective rebalancing strategy.
Q5. Is it appropriate to initiate contrarian buying when the Fear & Greed Index enters "Fear" territory?
While drops in the Fear & Greed Index offer clues of an oversold condition, downward trends can extend longer when major political events like an election intersect with interest rate uncertainties. Even when considering staged dollar-cost averaging, entering positions after key events pass and forward earnings guidance is clarified remains a prudent approach.