KOSPI
The KOSPI fell below the 6,400 mark for the first time in two months amid heavy foreign net selling exceeding 1 trillion KRW, liquidity voids following the end of share buybacks, and profit-taking in semiconductors.
 삼성전자
 SK하이닉스
 삼성전자우
 SK스퀘어
 삼성전기
 LG에너지솔루션
 현대차
 KB금융
 삼성바이오로직스
 삼성생명
 삼성물산
 신한지주
 두산에너빌리티
 삼성SDI
 한화에어로스페이스
 기아
 셀트리온
 SK
 HD현대중공업
 하나금융지주
The KOSPI fell below the 6,400 mark for the first time in two months amid heavy foreign net selling exceeding 1 trillion KRW, liquidity voids following the end of share buybacks, and profit-taking in semiconductors.
The KOSDAQ sank more than 4% as institutional and foreign investors dumped tech growth names and semiconductor materials, parts, and equipment stocks.
The Nasdaq maintained solid momentum in the prior session, rising 0.64% on bargain hunting across mega-cap tech names including Microsoft and Amazon.
Persistent debates over the monetization gap relative to massive AI capital expenditures and volatility in U.S. Treasury yields could sustain foreign outflows and amplify index swings.
A sentiment indicator showing how fearful or greedy investors are about the market.
Key components behind the index
Track sentiment shifts over time
Interpret the overall market temperature
We combine real-time indicators such as KOSPI, KOSDAQ, Nasdaq, and USD/KRW to measure overall market conditions.
Expand a category to view featured and recent posts.

Kakao hosts 'if kakao 26' on Oct 13–14, 2026, unveiling its agentic AI roadmap. Consolidating 'Kanana' into KakaoTalk as...
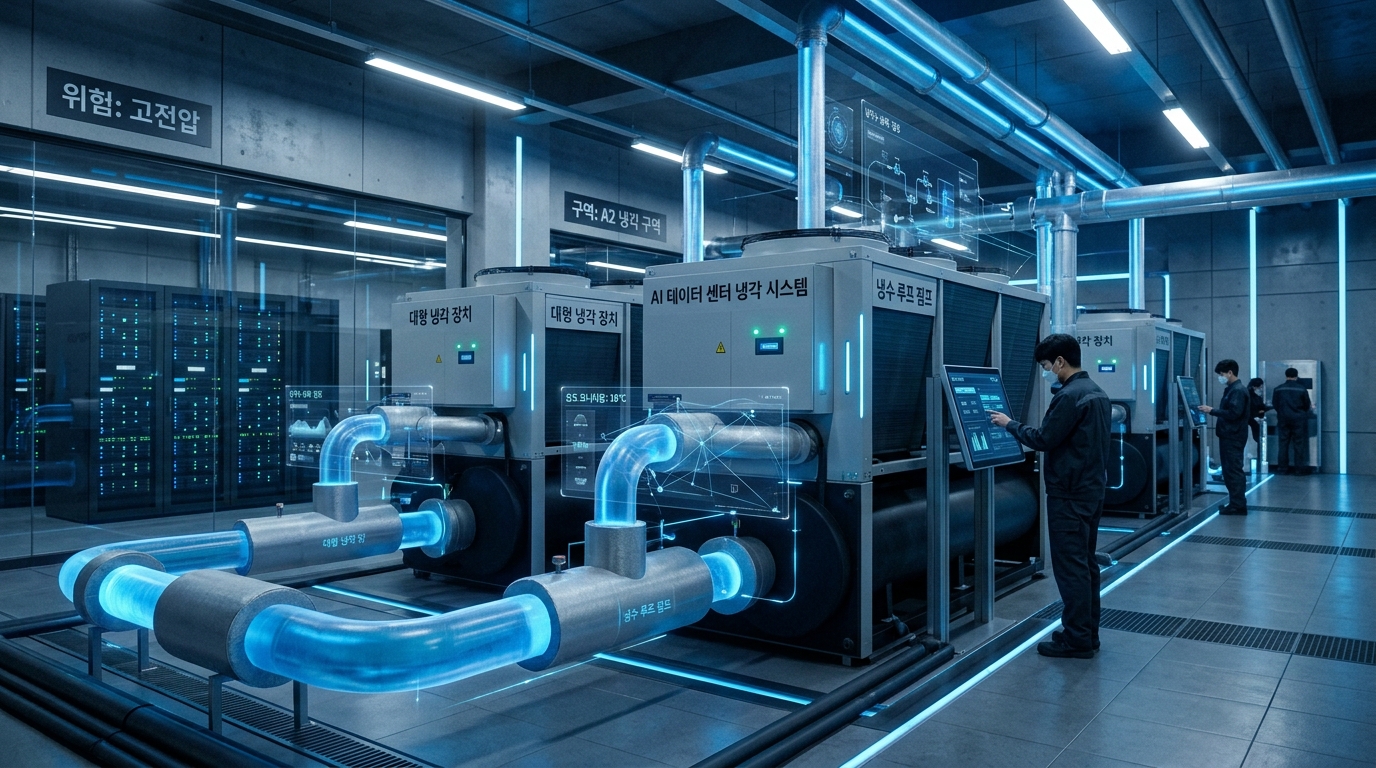
LG Electronics secured a 5GW AI data center cooling deal with AIR Control Concepts. Shifting from B2C appliances to B2B ...
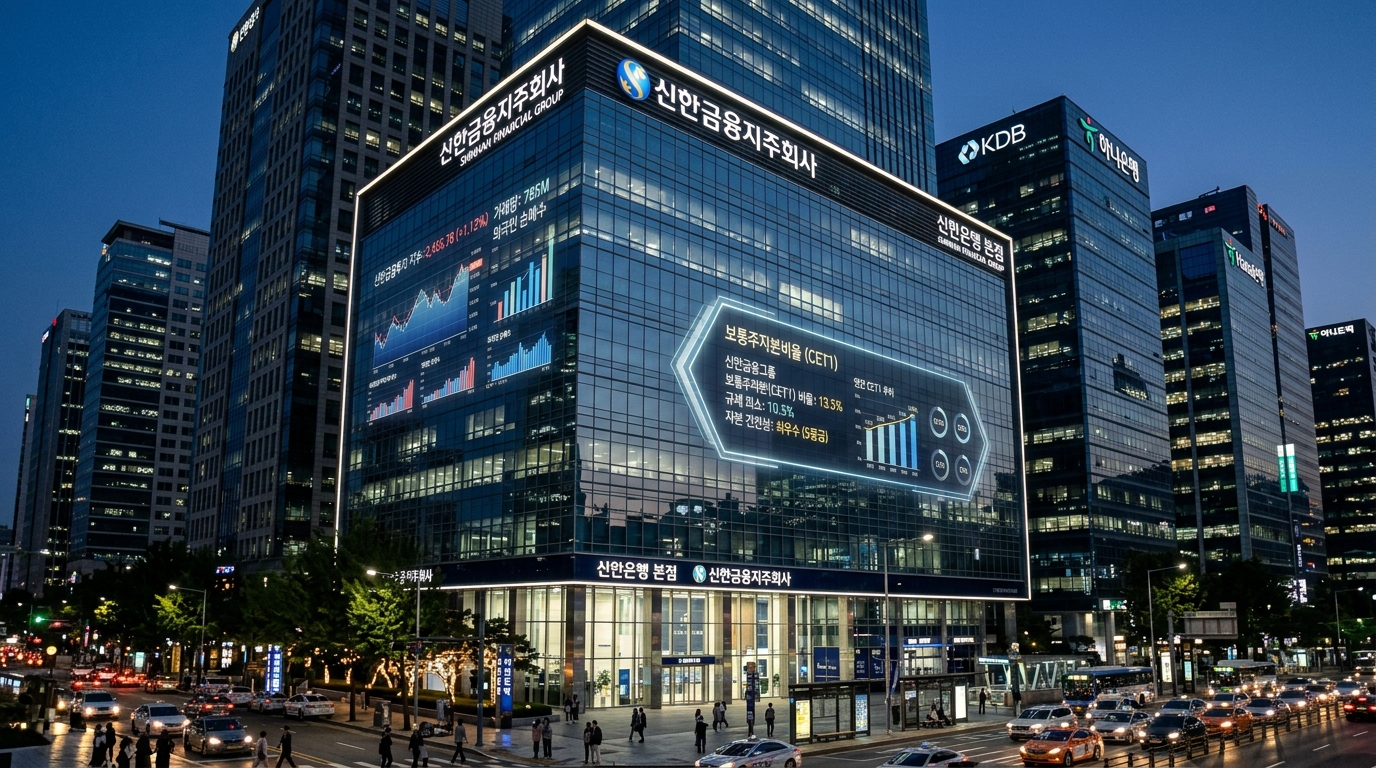
Shinhan Financial Group's Q3 2026 net profit is estimated at 1.61T–1.70T KRW amid securities weakness, but CET1 is proje...
HPSP faces uncertainty as YESTI wins a patent ruling, threatening its 100% monopoly in high pressure hydrogen annealing....
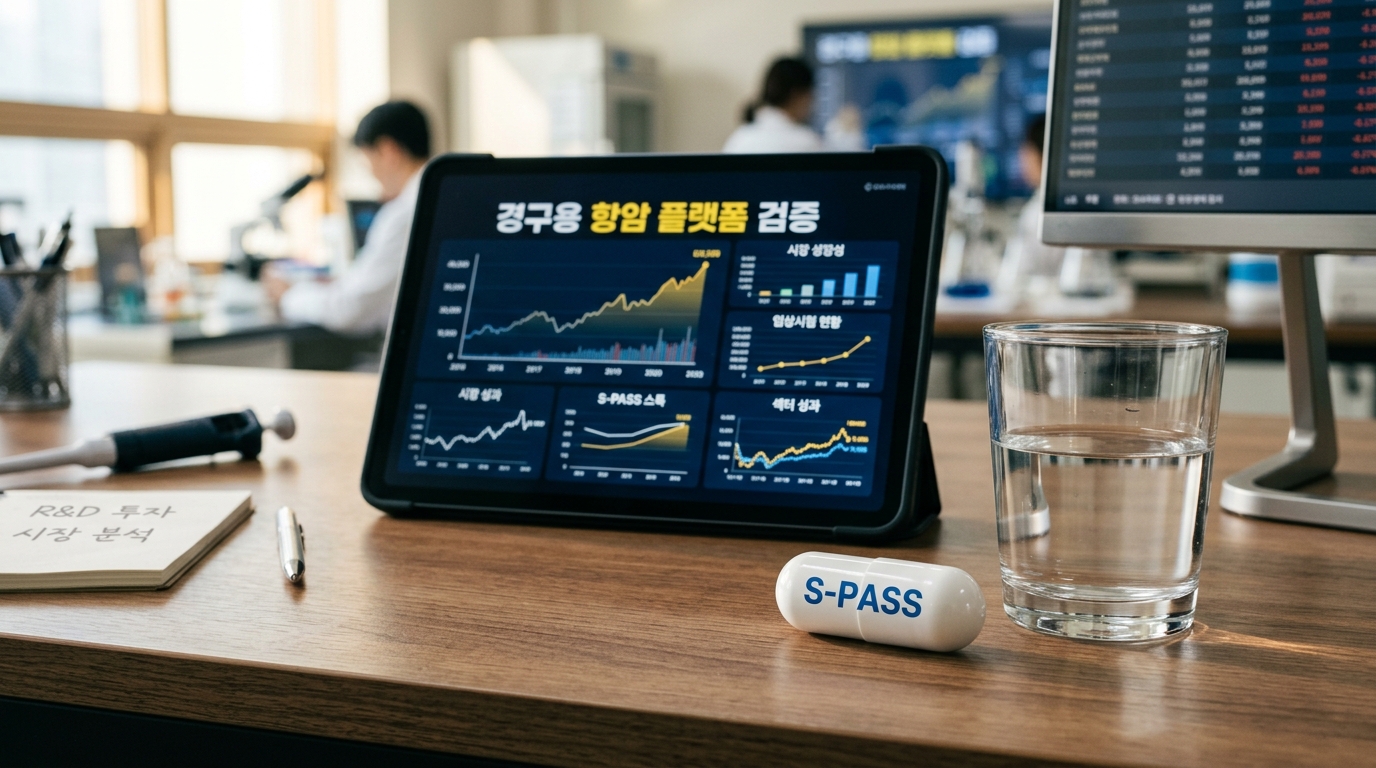
Samchundang Pharm 000250 faces controversy over its proposed oral Keytruda using the S PASS platform after Merck denied ...
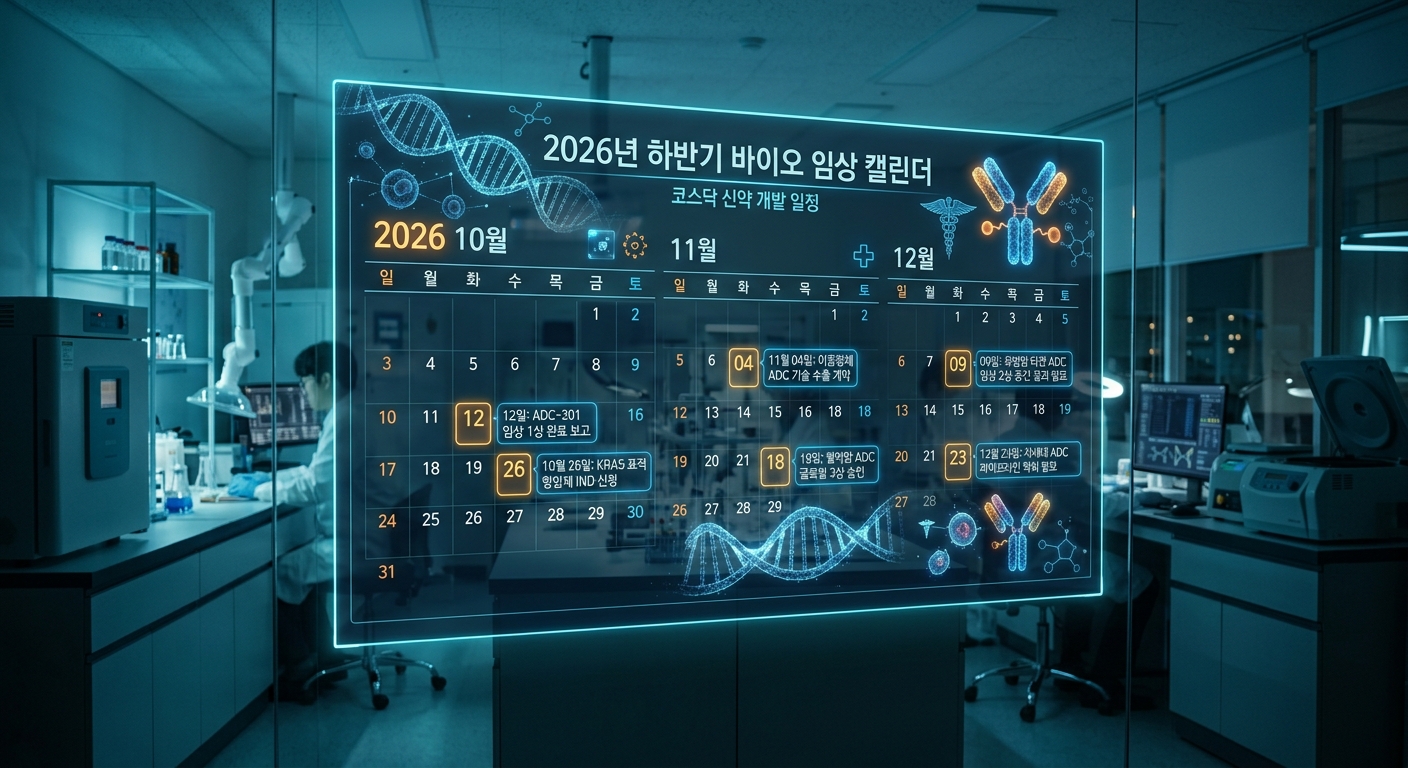
As KOSDAQ fluctuates, the spotlight is on the H2 2026 clinical timelines and pipeline momentum of leading biotech firms ...
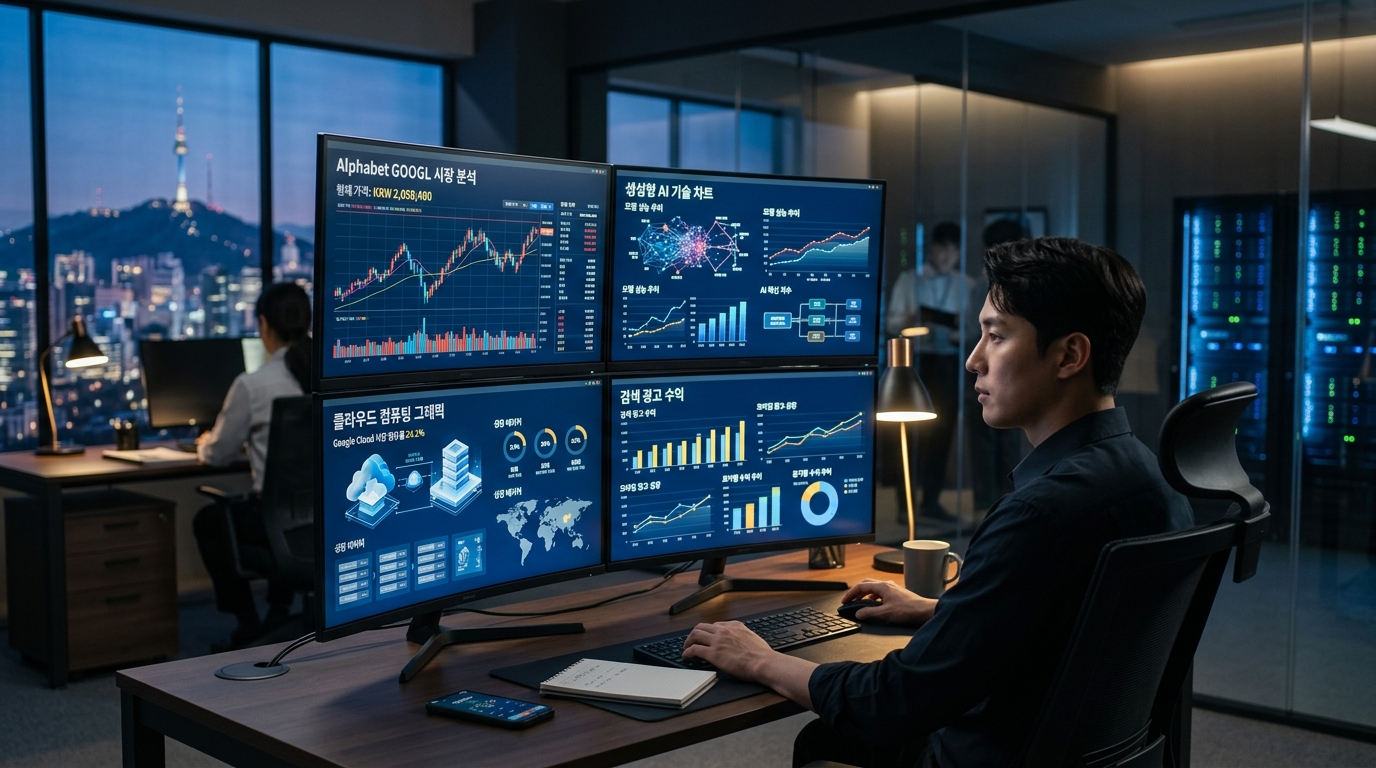
Alphabet overcomes AI search cannibalization concerns as Gemini Enterprise fuels cloud growth. However, annual Capex top...
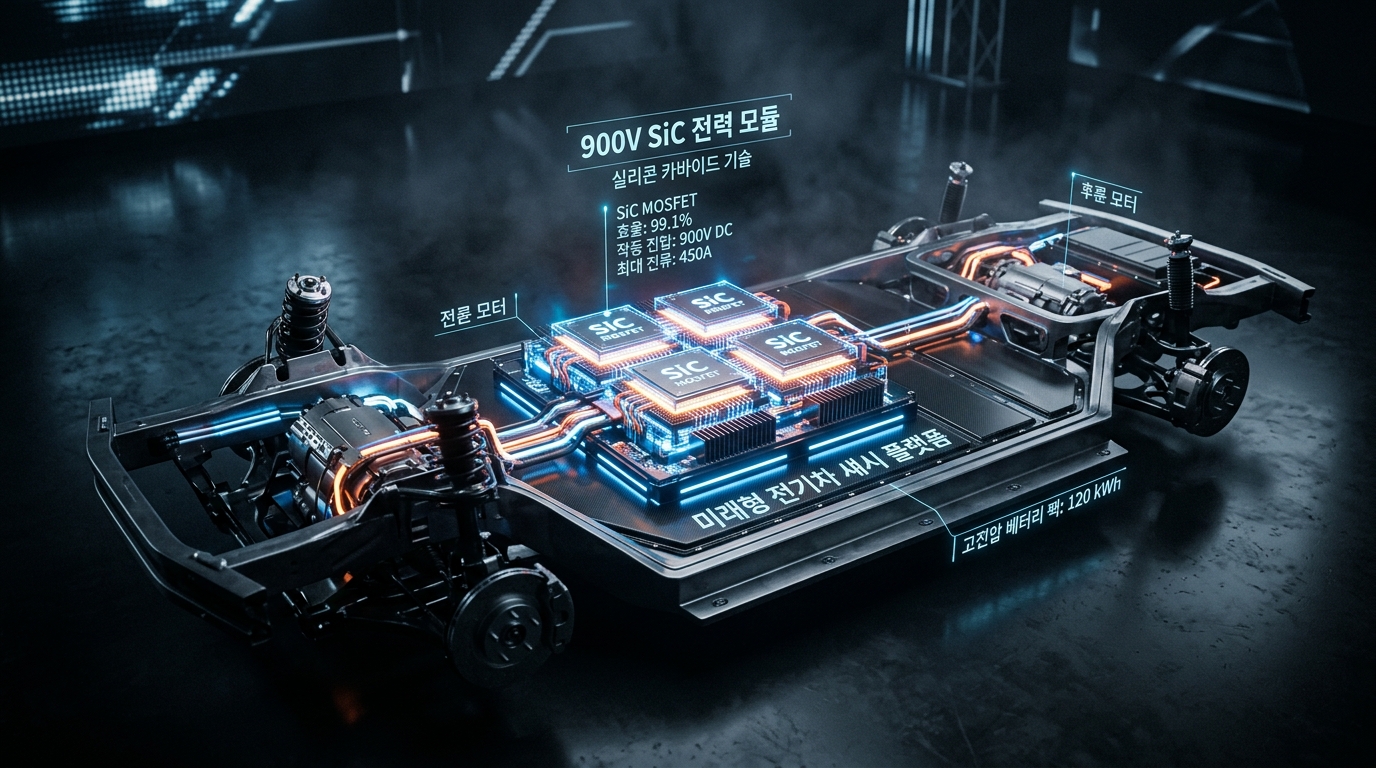
Overcoming the EV chasm and legacy inventory corrections, onsemi ON is laying the groundwork for an earnings turnaround ...
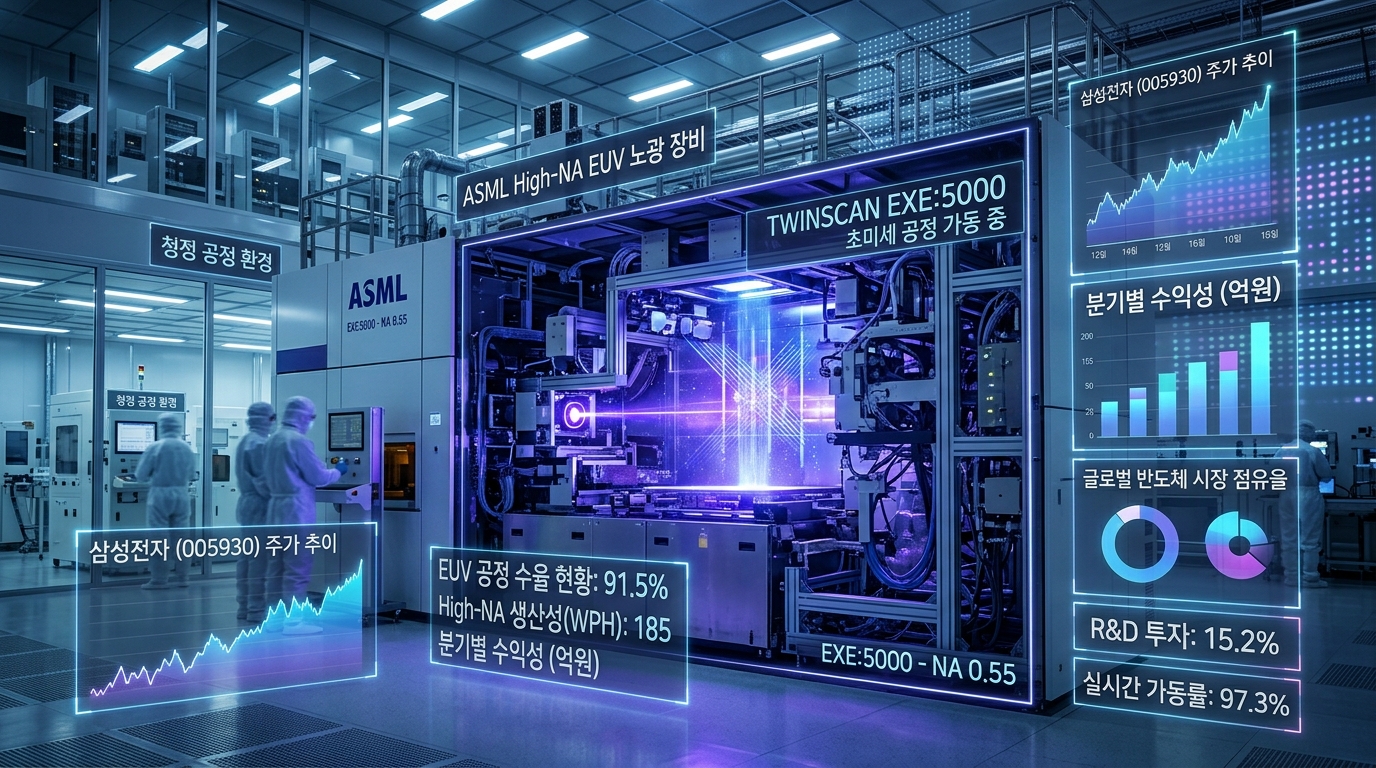
ASML enters the mass delivery phase for High NA EUV lithography systems. Foundries including Intel, TSMC, and Samsung ac...
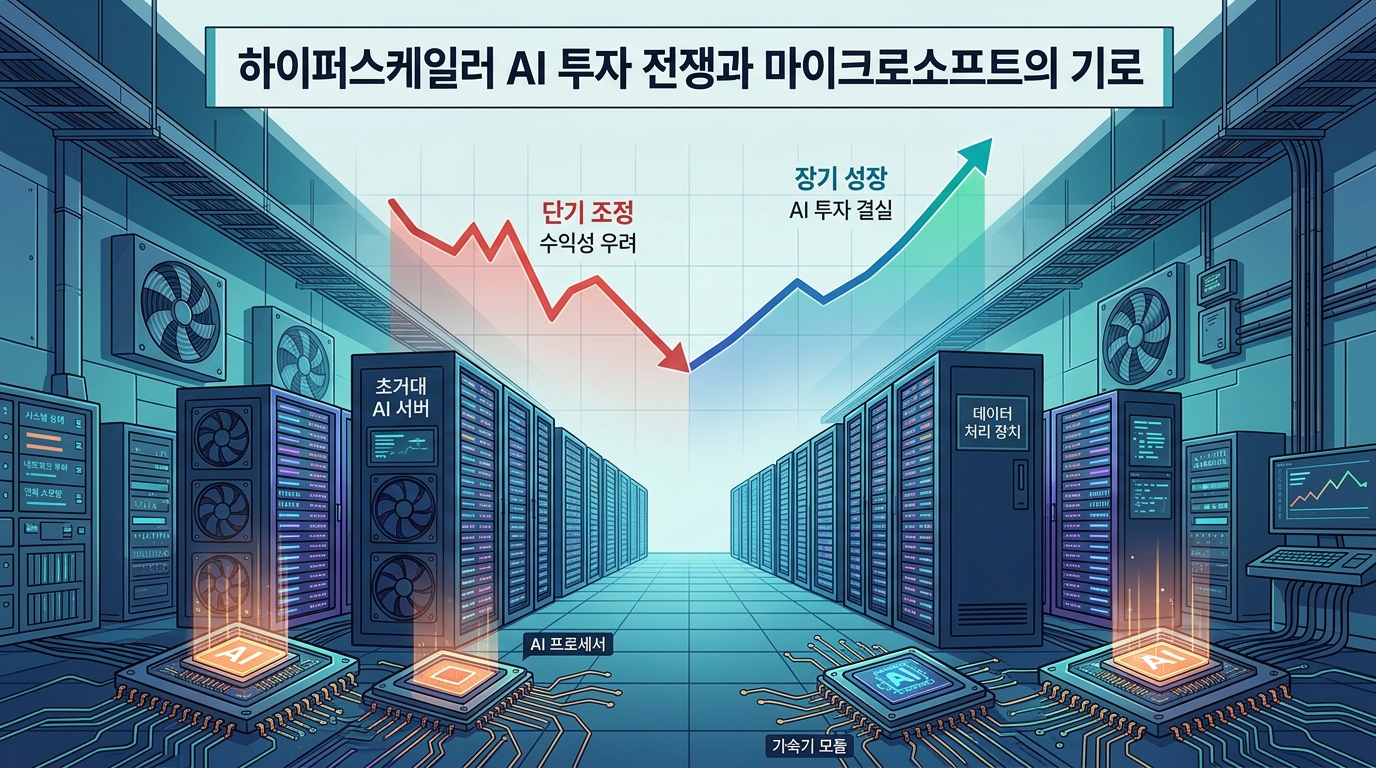
Microsoft's valuation reaches a 3 year low of ~21x Forward P/E amid high capital expenditures. While AI run rate hit $37...

We delve into the Atlanta Fed's 'GDPNow' estimate, a real time compass for the US economy, and the subsequent S&P 500 ma...
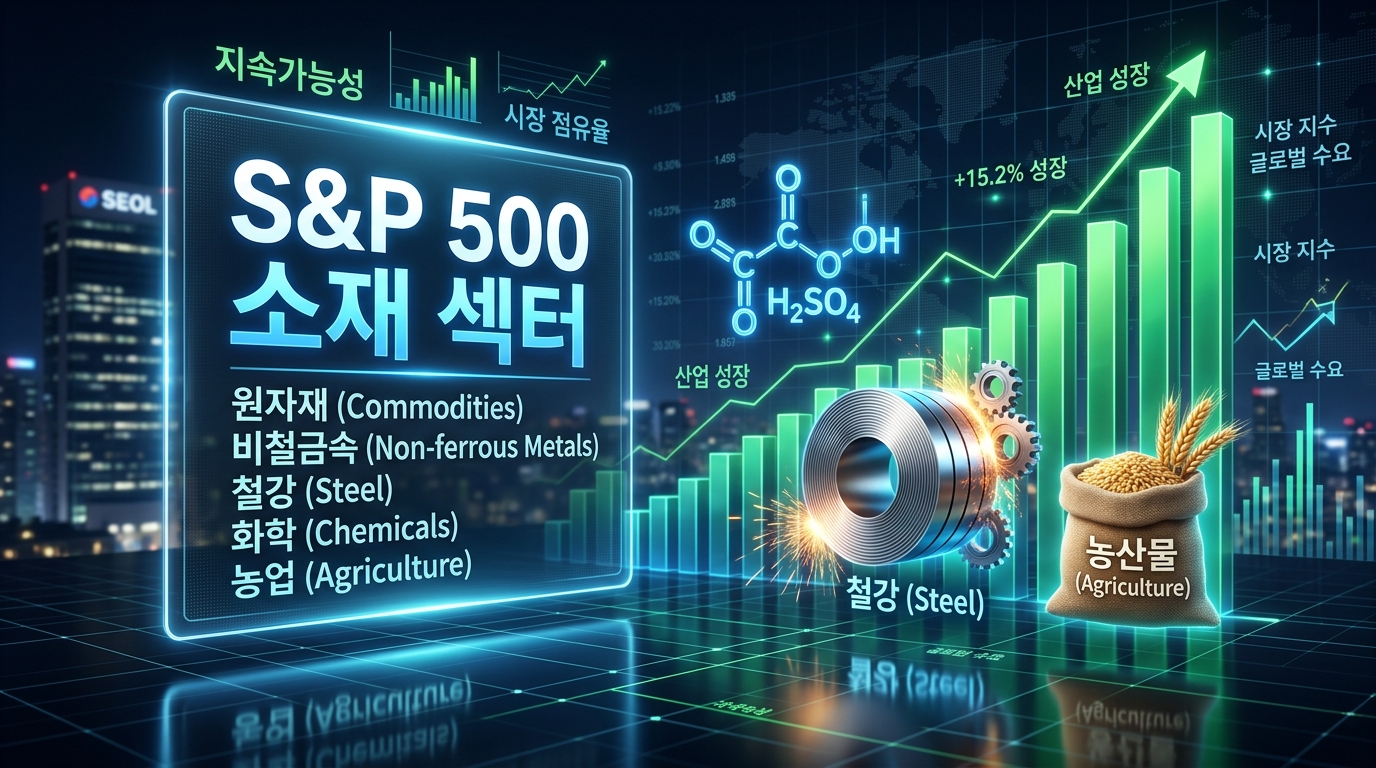
S&P Global forecasts a 35% surge in the Commodity Price Index MPI by Q3 2026 due to geopolitics. While US manufacturing ...
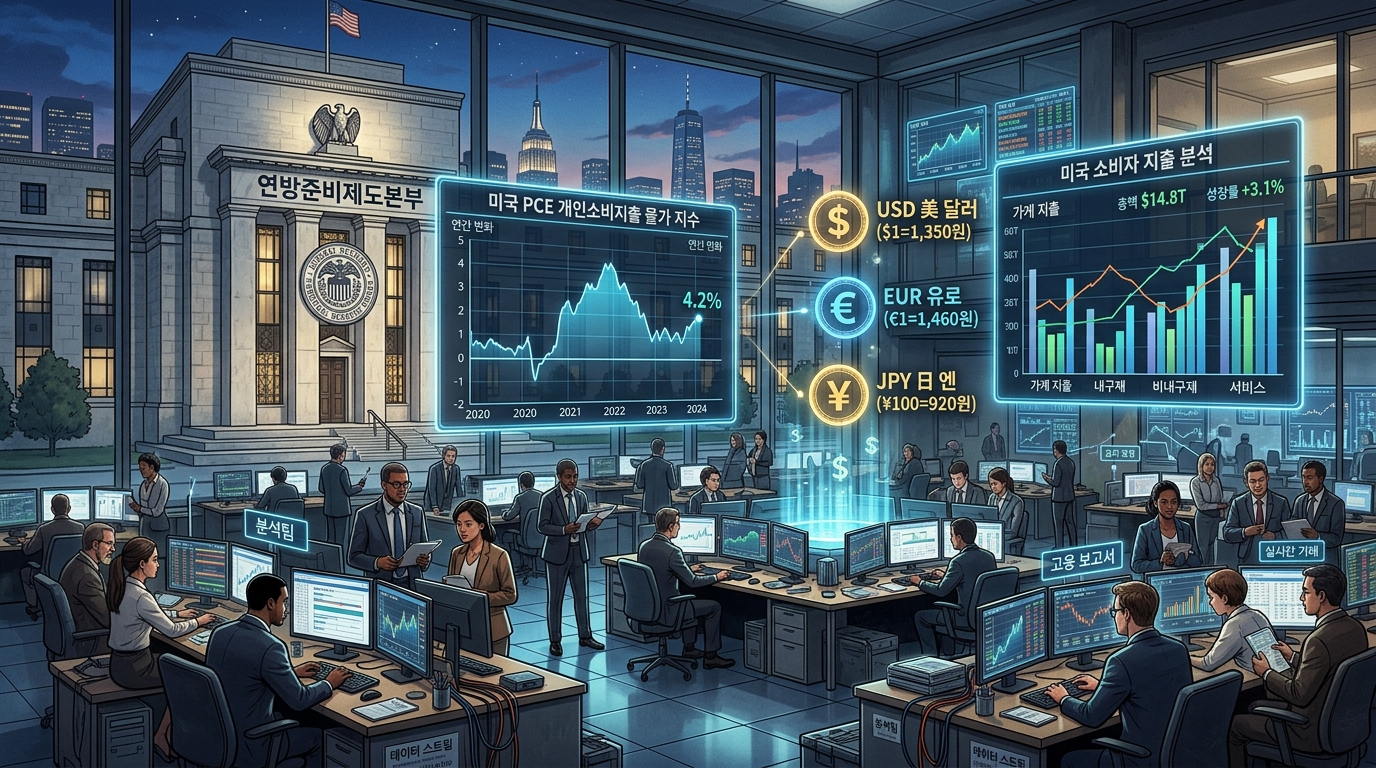
Ahead of the US August PCE release, markets weigh the Fed's rate trajectory. With headline PCE expected at ~3.7% and cor...
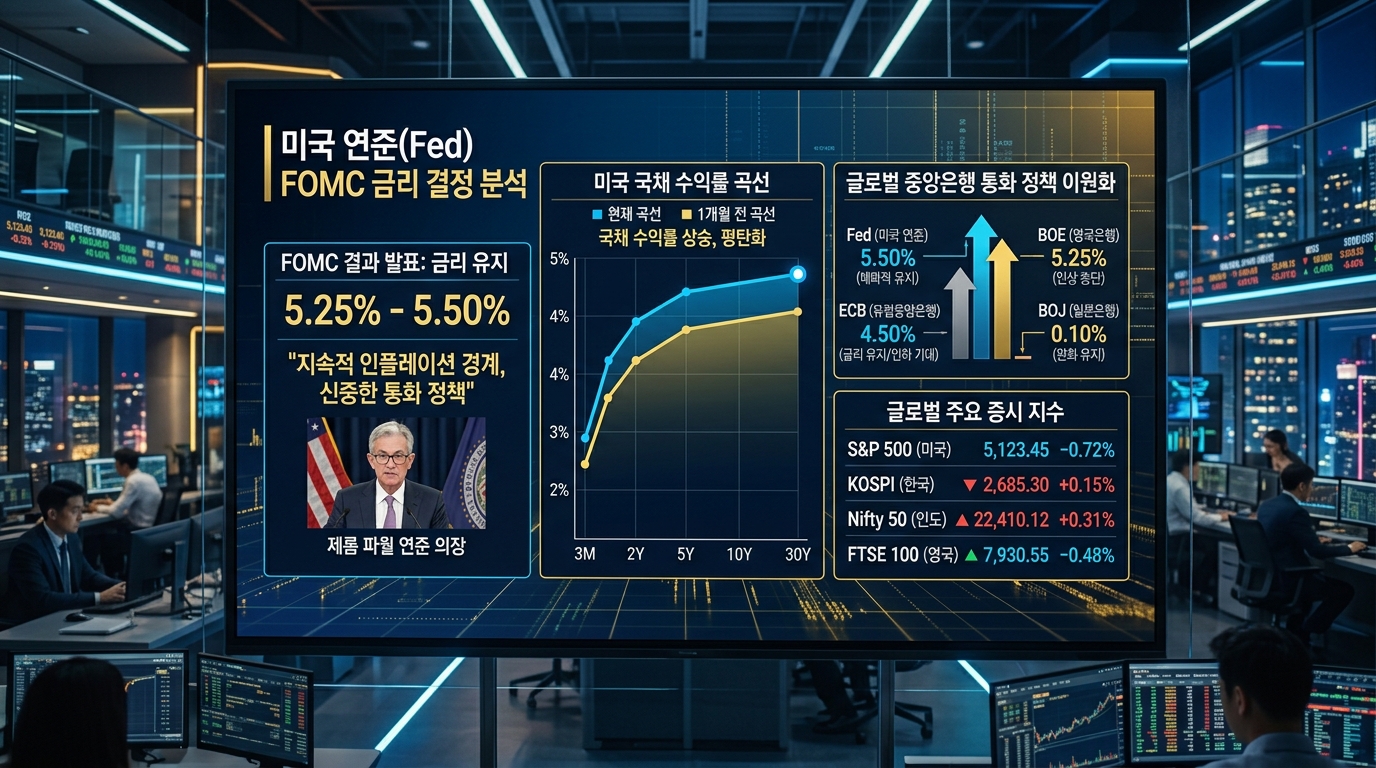
Following the September FOMC rate cut, Treasury yields diverged amid fiscal deficit concerns, driving a tri polar decoup...
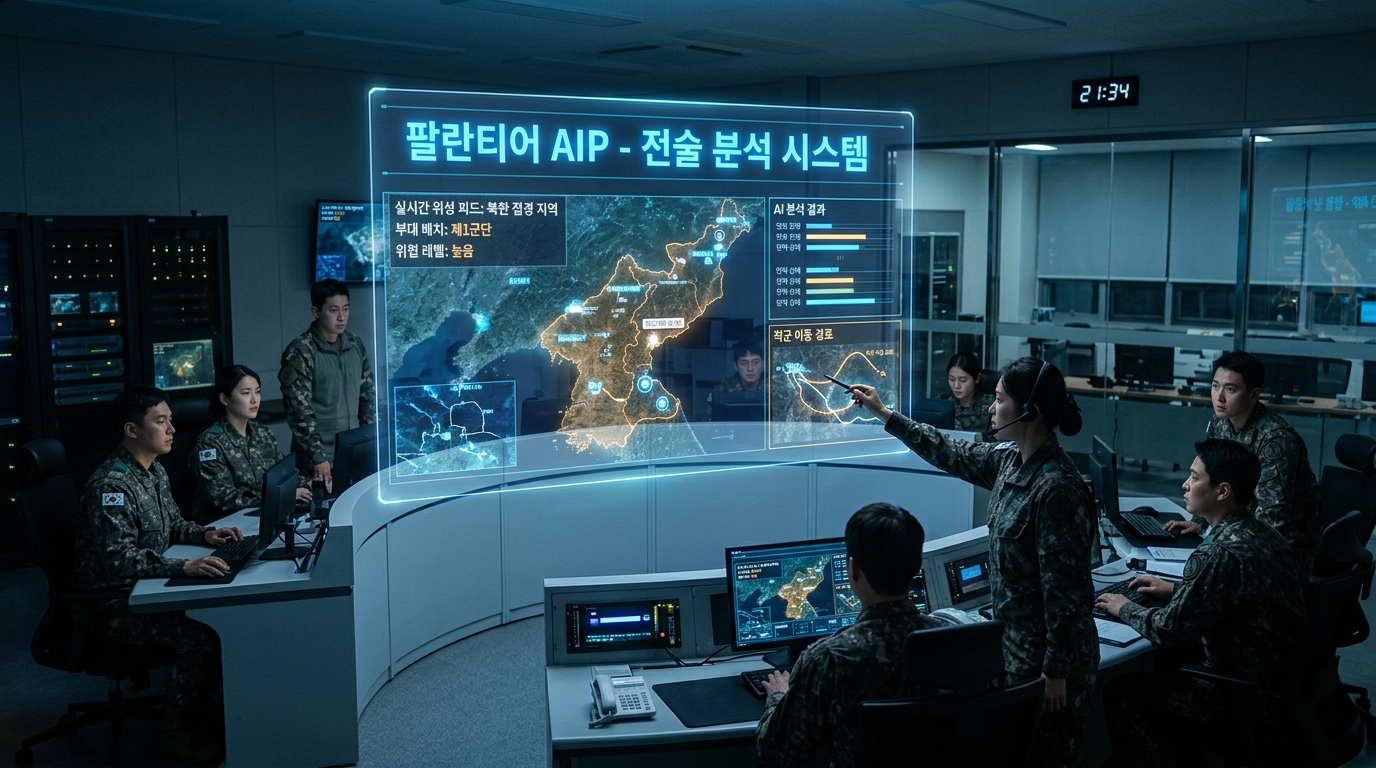
Palantir PLTR accelerates government contracts by deeply integrating AIP into core DoD systems, backed by Maven and TITA...