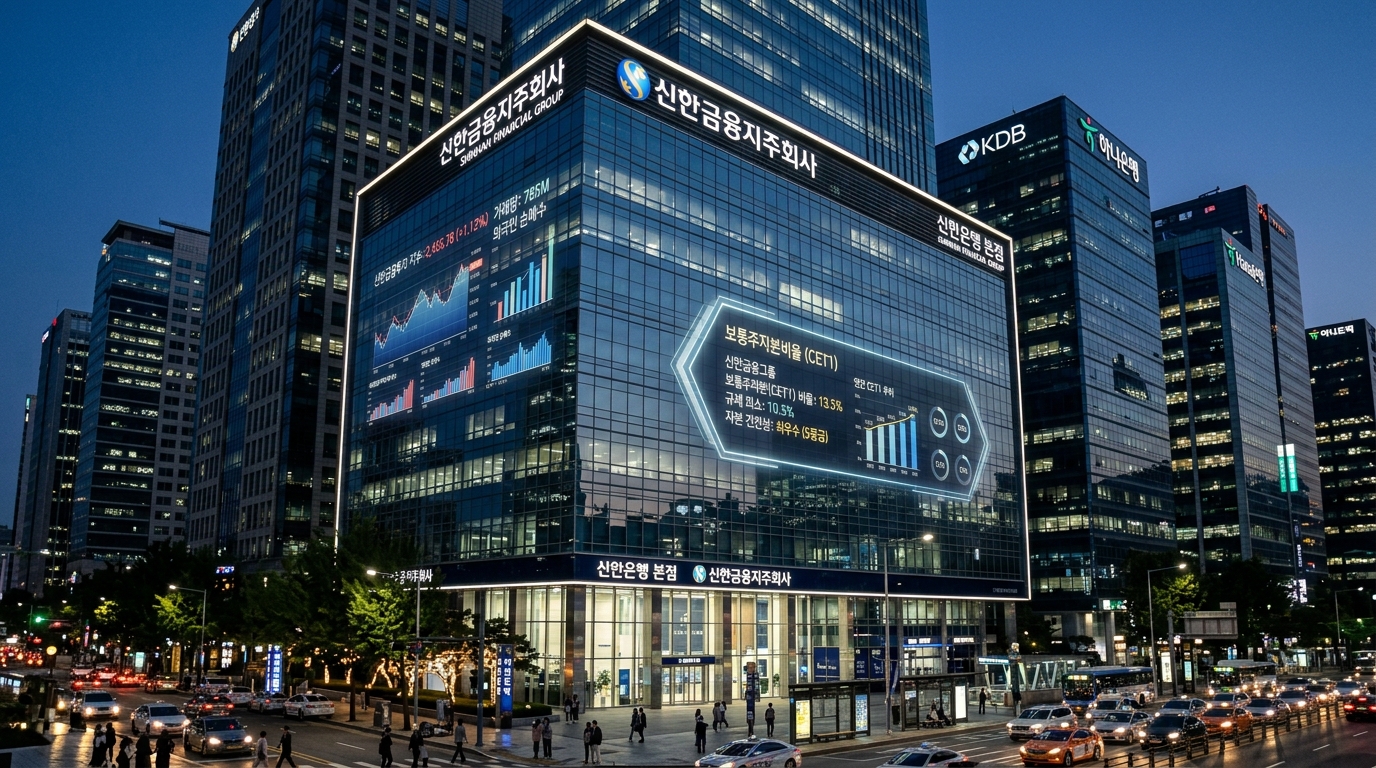
This is Daily Stock, delivering in-depth analysis of major financial market indicators and key listed corporate fundamentals.
Key Summary
Shinhan Financial Group's (055550) Q3 2026 net profit attributable to controlling interests is estimated at around 1.61 trillion to 1.70 trillion KRW. Despite the recognition of one-off real estate disposal gains, a slight quarter-on-quarter decline in profit is expected due to weakness in its securities subsidiary.
On the other hand, aided by a stable KRW/USD exchange rate and rigorous risk-weighted asset (RWA) management, the group's Common Equity Tier 1 (CET1) ratio for Q3 is projected to reach approximately 13.6%, an improvement of 15–20 bps quarter-on-quarter.
Under Shinhan Financial Group's declared 'Value-up 2.0' formula (Total Shareholder Return Ratio = 1 - [RWA Growth Rate / Target ROE] + α), capital exceeding a 13% CET1 ratio is expected to strongly support an additional share buyback and cancellation of approximately 200 billion to 250 billion KRW during the fourth quarter.
Market Context
As of October 10, 2026, domestic equity markets closed with the KOSPI at 6,625.93 and the KOSDAQ at 892.27, while the NASDAQ recorded 27,366.17 and the KRW/USD exchange rate stood at 1,343.80 KRW.
Shinhan Financial Group's share price on the day remains unconfirmed (based on the latest verified data), but securities firms are maintaining target prices in the 134,000 to 135,000 KRW range at a PBR level of approximately 0.9x.
According to the Daily Stock proprietary Fear & Greed Index, the KOSPI is currently in Fear territory (24.4), reflecting weakened sentiment compared to Neutral (40.1) one week ago and Neutral (50.9) one month ago, while the NASDAQ currently stands at Neutral (45).
Foreign investor flows show selective trading patterns across large-cap index stocks as the KRW/USD exchange rate settles into the 1,340 KRW range.
Ahead of its Q3 earnings release, Shinhan Financial Group is set to reflect approximately 250 billion KRW in real estate disposal gains, including gains from selling the Shinhan Card headquarters (approx. 170 billion KRW) and Shinhan Bank's Myeong-dong site (approx. 80 billion KRW).
However, non-interest income volatility increased due to reduced brokerage fees in the securities division, securities valuation losses tied to interest rate fluctuations, and overseas alternative investment impairment losses (over 50 billion KRW).
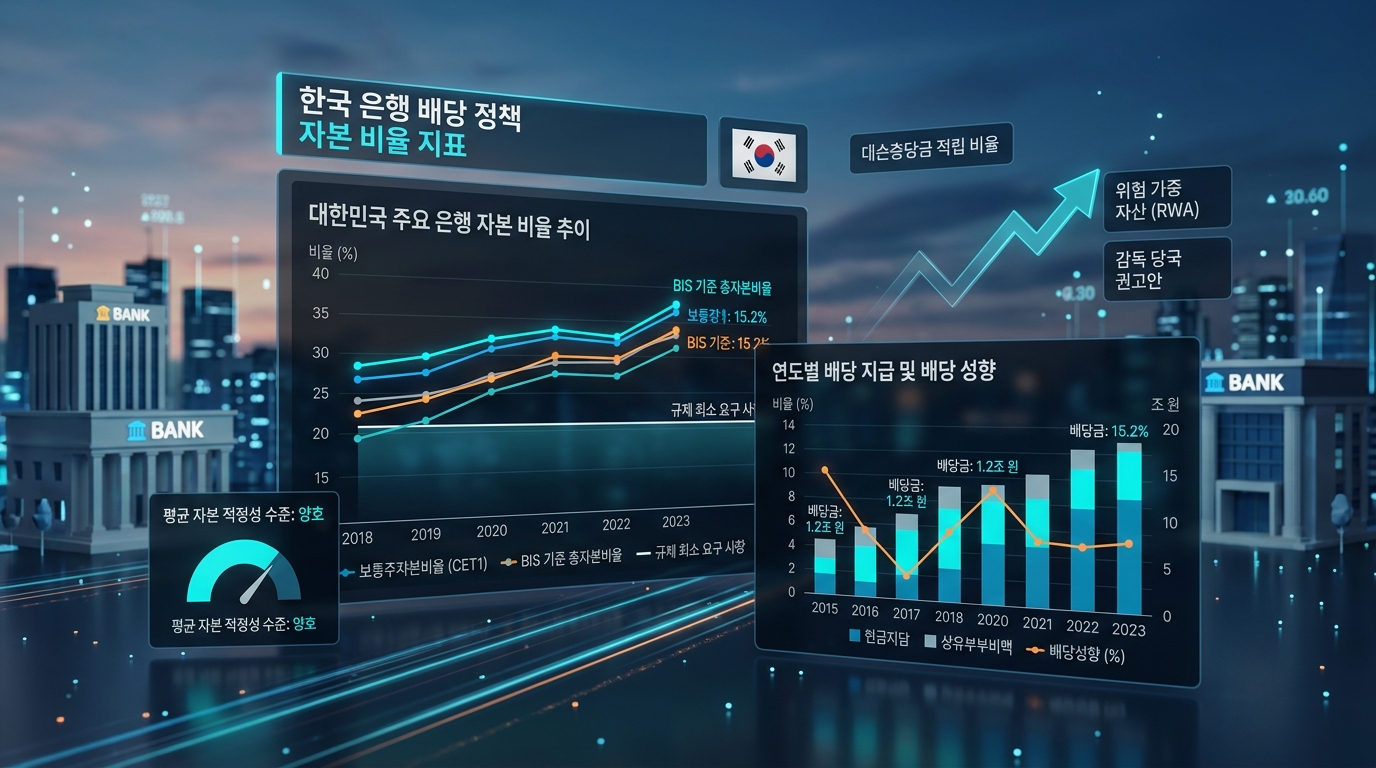
Financial Analysis
Shinhan Financial Group's core banking business maintains solid loan asset growth, though funding cost pressures have led to a slight margin contraction.
Q3 KRW loan growth increased 1.4–2.0% quarter-on-quarter, driven evenly by household and corporate loans, but the net interest margin (NIM) is estimated to have declined by approximately 3–4 bps compared to the prior quarter.
Group credit costs are assessed to be well-defended within an ordinary range at around 527.0 billion to 530.0 billion KRW.
In the non-banking segment, despite efforts by the card unit to stabilize funding costs, poor securities trading performance at the securities subsidiary capped overall consolidated earnings.
| Financial Metric (Consolidated) | Q3 2026 Forecast | Trend vs. Prior Quarter (2Q26) | Notes |
|---|---|---|---|
| Net Profit (Controlling Interests) | 1.6157T – 1.7020T KRW | -6.5% to -11.2% | Real estate disposal gains vs. non-bank weakness |
| Net Interest Income | Approx. 3.1460T KRW | Around +0.4% | Loan growth (+1.4–2.0%) vs. NIM decline (-3–4 bps) |
| Non-Interest Income | Approx. 1.1000T – 1.1250T KRW | Around -22.4% | Securities fee contraction & alternative investment impairments |
| Group Credit Costs | Approx. 527.0B – 530.0B KRW | Maintains ordinary level | Continued preemptive provisioning stance |
| CET1 Ratio | Approx. 13.60% – 13.62% | +15 bps to +20 bps | FX decline effect & RWA control |
Valuation
Shinhan Financial Group maintains a Return on Equity (ROE) of around 10%, highlighting its valuation appeal relative to profitability.
As PBRs across major domestic financial holding companies converge toward the 0.8–1.0x range, Shinhan Financial Group trades at a relative discount of around 10% compared to peers.
Compared to global peers, such as large U.S. commercial banks averaging PBRs of 1.1–1.3x, the stabilizing capital ratios and shareholder return visibility of Korean financials serve as justification to narrow this valuation gap.
If the KRW/USD exchange rate maintains its stability in the low 1,340 KRW range, valuation pressure on risk-weighted assets decreases, structurally securing additional capital buffer.
Expert & Institutional Analysis
Major domestic research institutions assign high marks to the predictability of the 'Shinhan Value-up 2.0' framework.
SK Securities noted that if RWA growth is contained within 4–5%, the annual total shareholder return ratio will stably remain at 50.2%–51.8%.
Hana Securities and NH Investment & Securities also projected the Q3 CET1 ratio to improve to around 13.6%, bolstered by a falling exchange rate and a reduction in market RWA.
Consequently, an announcement of an additional share buyback and cancellation worth 200 billion to 250 billion KRW for Q4 during the Q3 earnings conference call is considered highly likely.
Risk Factors
The most immediate risk lies in earnings volatility at non-banking subsidiaries and the potential expansion of impairment losses on alternative investments, including overseas commercial real estate.
A prolonged slowdown in financial market trading volume could delay the recovery of fee income at the securities unit.
From a macroeconomic perspective, the direction of the Bank of Korea's benchmark interest rate policy and rising delinquency rates among borrowers due to an economic slowdown remain burdens.
There is also ongoing sensitivity to sharp spikes in exchange rates, which would increase foreign currency-denominated RWAs and dilute the CET1 ratio.
Investment Perspective
While Shinhan Financial Group is experiencing quarterly earnings volatility due to slowing Q3 non-interest income, this is offset by structural improvements in its common equity capital ratio.
Stabilizing the CET1 ratio at 13.6% is likely to act as a clear trigger for an additional Q4 share buyback and cancellation under the Value-up 2.0 formula.
Ultimately, focus should be placed on risk-weighted asset management capabilities and the sustainability of a 50%+ total shareholder return policy rather than temporary quarterly profit contractions.
Investor Checkpoint Q&A
Q1. What is the primary reason Shinhan Financial Group's Q3 net profit is expected to decline quarter-on-quarter?
A1. Although real estate disposal gains of approximately 250 billion KRW (card headquarters and bank Myeong-dong building) are recognized, brokerage fee contraction at the securities subsidiary, securities valuation losses, and overseas alternative investment impairments (over 50 billion KRW) are estimated to drive a 6.5–11% drop compared to the previous quarter.
Q2. What factors are driving the rise in the Q3 Common Equity Tier 1 (CET1) ratio?
A2. As the KRW/USD exchange rate declined, market RWA decreased. Together with conservative asset growth management and resilient underlying fundamentals, the ratio is projected to improve 15–20 bps quarter-on-quarter to around 13.6%.
Q3. How is the shareholder return ratio derived under the 'Shinhan Value-up 2.0' formula?
A3. Instead of a fixed ceiling, Shinhan Financial introduced the formula: '1 - (RWA Growth Rate / Target ROE) + α'. Controlling RWA growth at 4–5% while maintaining a 10% ROE yields a stable total shareholder return ratio exceeding 50%.
Q4. What is the anticipated size of the additional Q4 share buyback and cancellation?
A4. In addition to the cumulative 1.4 trillion KRW executed through Q3, a resolution for an additional 200 billion to 250 billion KRW buyback and cancellation during Q4 is seen as highly likely to achieve an annual total shareholder return ratio of 50–53%.
Q5. Could personal data leak issues or non-bank losses undermine capital management policy?
A5. The market views related costs and IT investments as absorbable within recurring earnings. With the CET1 ratio firmly exceeding 13%, the likelihood of undermining the core shareholder return framework appears limited.